val-2j
Tritium Thermal Desorption Spectroscopy from LiTiO Solid Breeder
Case Description
This validation case models tritium thermal desorption spectroscopy (TDS) from neutron-irradiated LiTiO (lithium titanate) crystalline grains, a candidate solid tritium breeding material for Deuterium-Tritium (D-T) fusion reactors. The experimental data and model are from Kobayashi et al. (2015).
LiTiO samples were irradiated at the Kyoto University Reactor (KUR) at various neutron fluences. After irradiation, the tritium release behavior was measured by TDS with a heating rate of 5 K/min starting from 300 K using pure helium as the purge gas. The average grain radius was 1.5 m.
Sample E (high defect density, = m, corresponding to 0.018 defect/LiTiO) is modeled, where tritium release is significantly influenced by trapping at O-centers and defect annihilation.
Model Description
Diffusion of Mobile Species
TMAP8 simulates tritium diffusion and trapping in a single spherical grain of LiTiO using 1D spherical coordinates (coord_type = RSPHERICAL). The governing equation for mobile tritium concentration is (Kobayashi et al., 2015):
(1)
where is the concentration of trapped tritium in O-centers and is the temperature-dependent diffusivity following the Arrhenius law:
(2)
where is the pre-exponential factor, is the activation energy, is the Boltzmann constant, and is the temperature.
Defect annihilation
During TDS heating, radiation-induced defect sites undergo first-order annihilation (Kobayashi et al., 2015):
(3)
where is the defect density and is the annihilation rate coefficient. The trap site fraction is related to . However, the exact relationship is not clearly indicated in (Kobayashi et al., 2015). Therefore, the initial trap site density is assumed to equal the defect density with with as the lattice site density.
is described as:
(4)
where and are the annihilation prefactor and energy, respectively. Raising the temperature reduces the available trap sites; the trap site fraction decays over time following Eq. (3), preventing re-trapping into annihilated sites. This is implemented by solving the annihilation equation self-consistently as an additional variable within the simulation, using a ReleasingNodalKernel.
Trapping and Detrapping
Only O-center (hydroxyl group) trapping is included in this model. As noted by Kobayashi et al. (2015) (p. 26), tritium release controlled by detrapping from F-centers (oxygen vacancies) occurs near 580 K, which corresponds to the release temperature controlled by the diffusion process itself. Because F-center detrapping is not rate-limiting relative to diffusion, it does not produce a distinct feature (i.e., peak) in the TDS spectrum, and is therefore excluded from the model.
The trapped concentration evolves according to:
(5)
where is the empty trap concentration.
The trapping and detrapping rate coefficients follow Arrhenius relationships:
(6)
(7)
where and are pre-factors of trapping and release rate coefficients, and and are the trapping and release energies. The last term in Eq. (5), , accounts for the trapped tritium atoms released when full defects are annealed.
Boundary and initial conditions
at (symmetry at grain center)
at (fast surface release, Kobayashi et al. (2015))
The mobile and trapped tritium concentrations are initialized at their local trapping/detrapping equilibrium values at the starting temperature = 300 K. The equilibrium mobile concentration is computed from the balance of trapping and detrapping rates. This avoids an initial transient from any imbalance between trapping and detrapping. Since the TDS output is normalized to arbitrary units, only the shape of the release curve matters, not the absolute concentrations.
Case and Model Parameters
The model parameters are summarized in Table 1.
Table 1: Values of model parameters.
| Parameter | Description | Value | Units | Reference |
|---|---|---|---|---|
| Grain radius | 1.5 | m | Kobayashi et al. (2015) | |
| Diffusivity pre-exponential | 6.9 | m/s | Kobayashi et al. (2015), Eq. 11 | |
| Diffusion activation energy | 1.07 | eV | Kobayashi et al. (2015), Eq. 11 | |
| detrapping prefactor | 4.1 | s | Kobayashi et al. (2015), Eq. 13 | |
| detrapping energy | 1.19 | eV | Kobayashi et al. (2015), Eq. 13 | |
| Trapping prefactor | 4.2 | s | Kobayashi et al. (2015), Eq. 21 | |
| Trapping energy | 1.04 | eV | Kobayashi et al. (2015), Eq. 21 | |
| Annihilation prefactor | 1.0 | s | Kobayashi et al. (2015), Eq. 18 | |
| Annihilation energy | 0.9 | eV | Kobayashi et al. (2015), Eq. 18 | |
| Lattice density | 1.88 | m | Calculated | |
| TDS heating rate | 5 | K/min | Kobayashi et al. (2015) | |
| Boltzmann constant | 1.380649 | J/K | PhysicalConstants.h | |
| Defect density (Sample E) | m | Kobayashi et al. (2015), Table 1 |
Results
Results before optimization
Figure 1 shows the comparison between TMAP8 and the experimental TDS spectrum for Sample E (high defect density). The O-center trapping model with defect annihilation captures the broad release profile. The high detrapping energy of O-centers (1.19 eV) produces a release peak above 650 K that is distinct from the diffusion-controlled release. The defect annihilation mechanism reduces the effective trap density at high temperatures, suppressing re-trapping and allowing tritium to escape more efficiently.
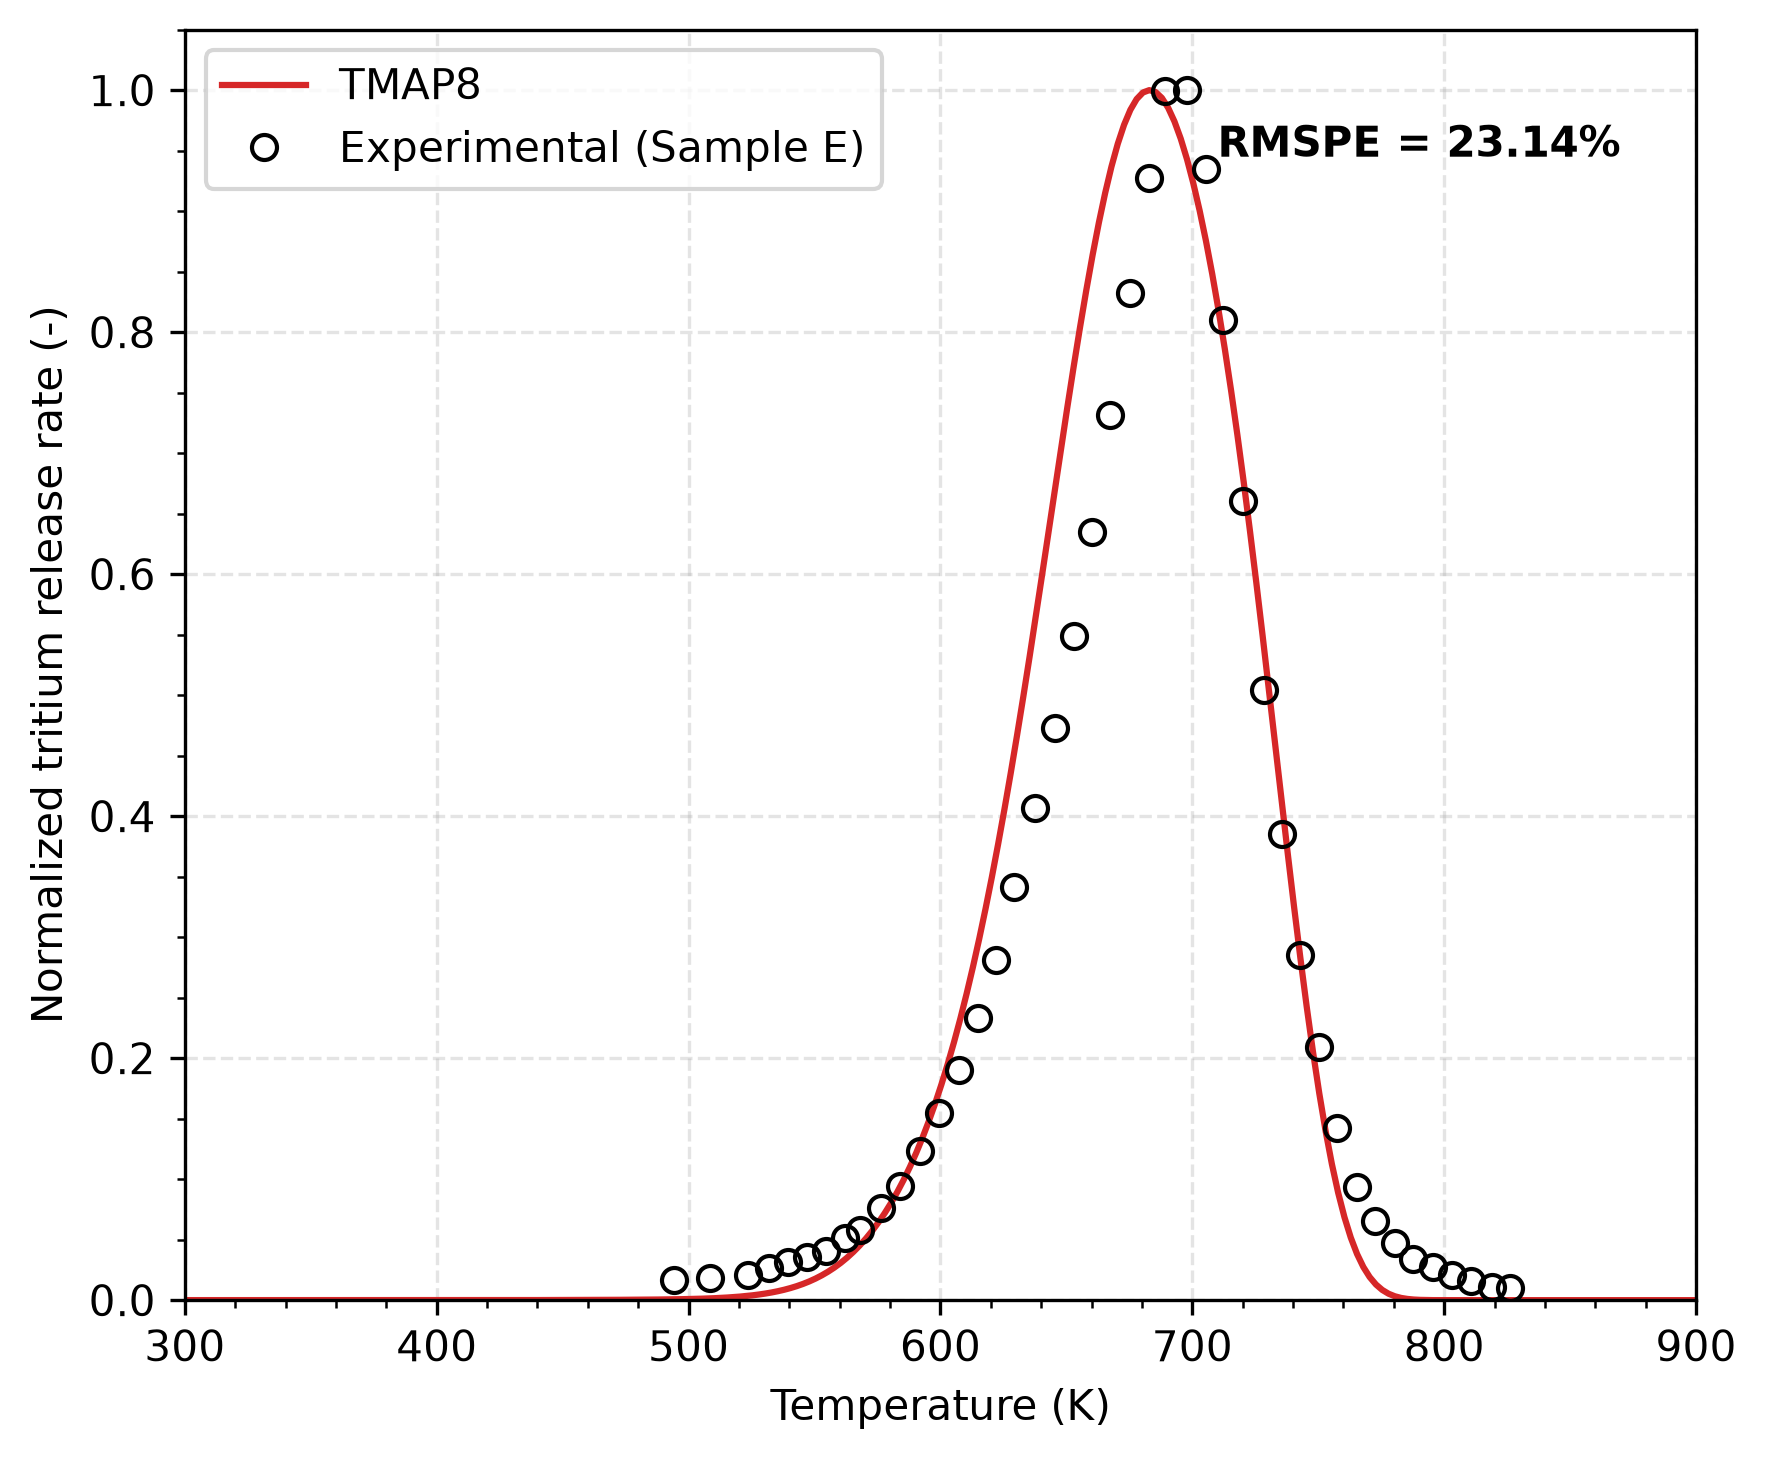
Figure 1: Comparison of TMAP8 calculation with the experimental TDS data for Sample E (high defect density).
Results after optimization
The agreement between the TMAP8 simulation and experimental data can be improved by optimizing the model parameters using the MOOSE stochastic tools module. A Bayesian optimization approach (Dhulipala et al., 2026) was applied to optimize eight key parameters (i.e., four Arrhenius pre-exponential factors (in log space) and four activation energies for the diffusivity, trapping, releasing, and defect annealing) to better match the experimental TDS curve for Sample E. As shown in Figure 2, the normalized defect density with the reference annihilation prefactor ( = 10 s) remains close to unity throughout the main release region (below ~750 K) and only decreases significantly at higher temperatures where the tritium release flux is decreasing. Larger annihilation prefactors would shift the defect annihilation and the associated tritium release to lower temperatures, but the optimization consistently finds values near the reference. The optimization used Gaussian Process active learning with Expected Improvement acquisition, running 40 iterations with 5 parallel proposals per iteration.
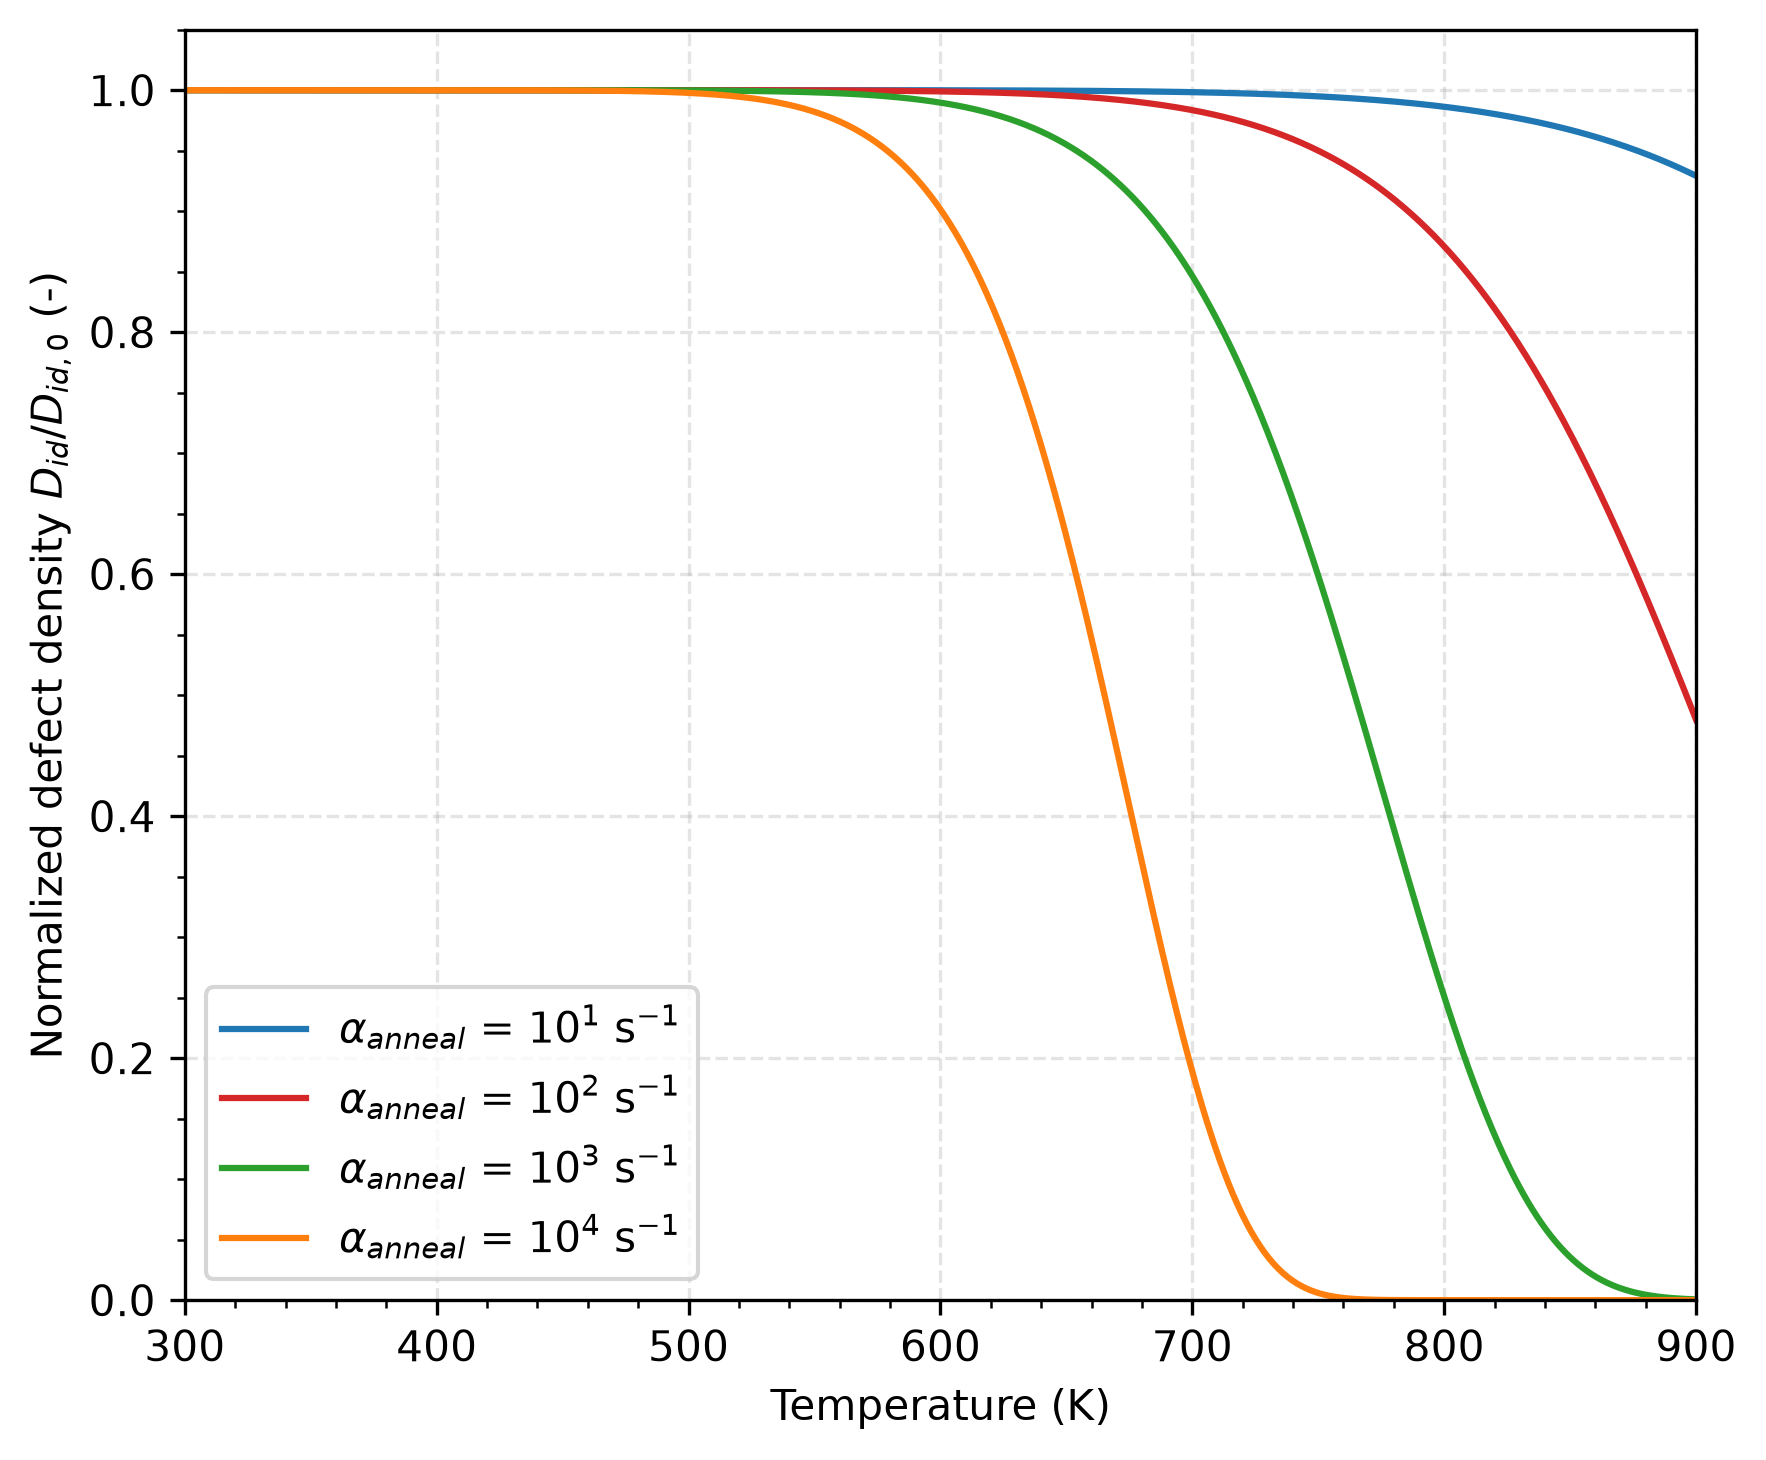
Figure 2: Evolution of the normalized defect density, , during the TDS temperature ramp. As expected, the annihilation temperature strongly depends on .
The objective function evaluates the root mean square percentage error (RMSPE) between the simulated and experimental normalized release rates using a continuous comparison at every simulation timestep. The experimental TDS curve is represented as a piecewise-linear interpolation function, and the RMSPE is accumulated over the full temperature ramp. Low-temperature constraint points (300–475 K) with a small target value penalize parameter sets that produce spurious early release peaks.
Table 2 compares the reference values from Kobayashi et al. (2015) with the Bayesian-optimized parameters, along with the parameter ranges used in the optimization.
Table 2: Reference and Bayesian-optimized parameter values.
| Parameter | Reference | Optimized | Range | Units |
|---|---|---|---|---|
| 6.9 | 4.50 | 10 – 10 | m/s | |
| 1.07 | 1.01 | 0.8 – 1.4 | eV | |
| 4.2 | 2.21 | 10 – 10 | s | |
| 1.04 | 0.82 | 0.8 – 1.3 | eV | |
| 4.1 | 2.14 | 10 – 10 | s | |
| 1.19 | 1.08 | 0.9 – 1.5 | eV | |
| 1.0 | 8.26 | 10 – 10 | s | |
| 0.9 | 1.27 | 0.5 – 1.5 | eV |
Figure 3 compares the reference parameter values from Kobayashi et al. (2015) (blue dashed lines) with the Bayesian-optimized values (red solid lines) for each of the eight fitted parameters. The green curves show the distribution of the parameters with top 20% RMSPE evaluations from the Bayesian optimization, providing insight into which parameter regions produce good fits to the experimental data. The gray shaded region indicates the search range used during optimization. The optimized values fall within the high-density regions of the distributions, confirming consistency with the near-optimal parameter space.
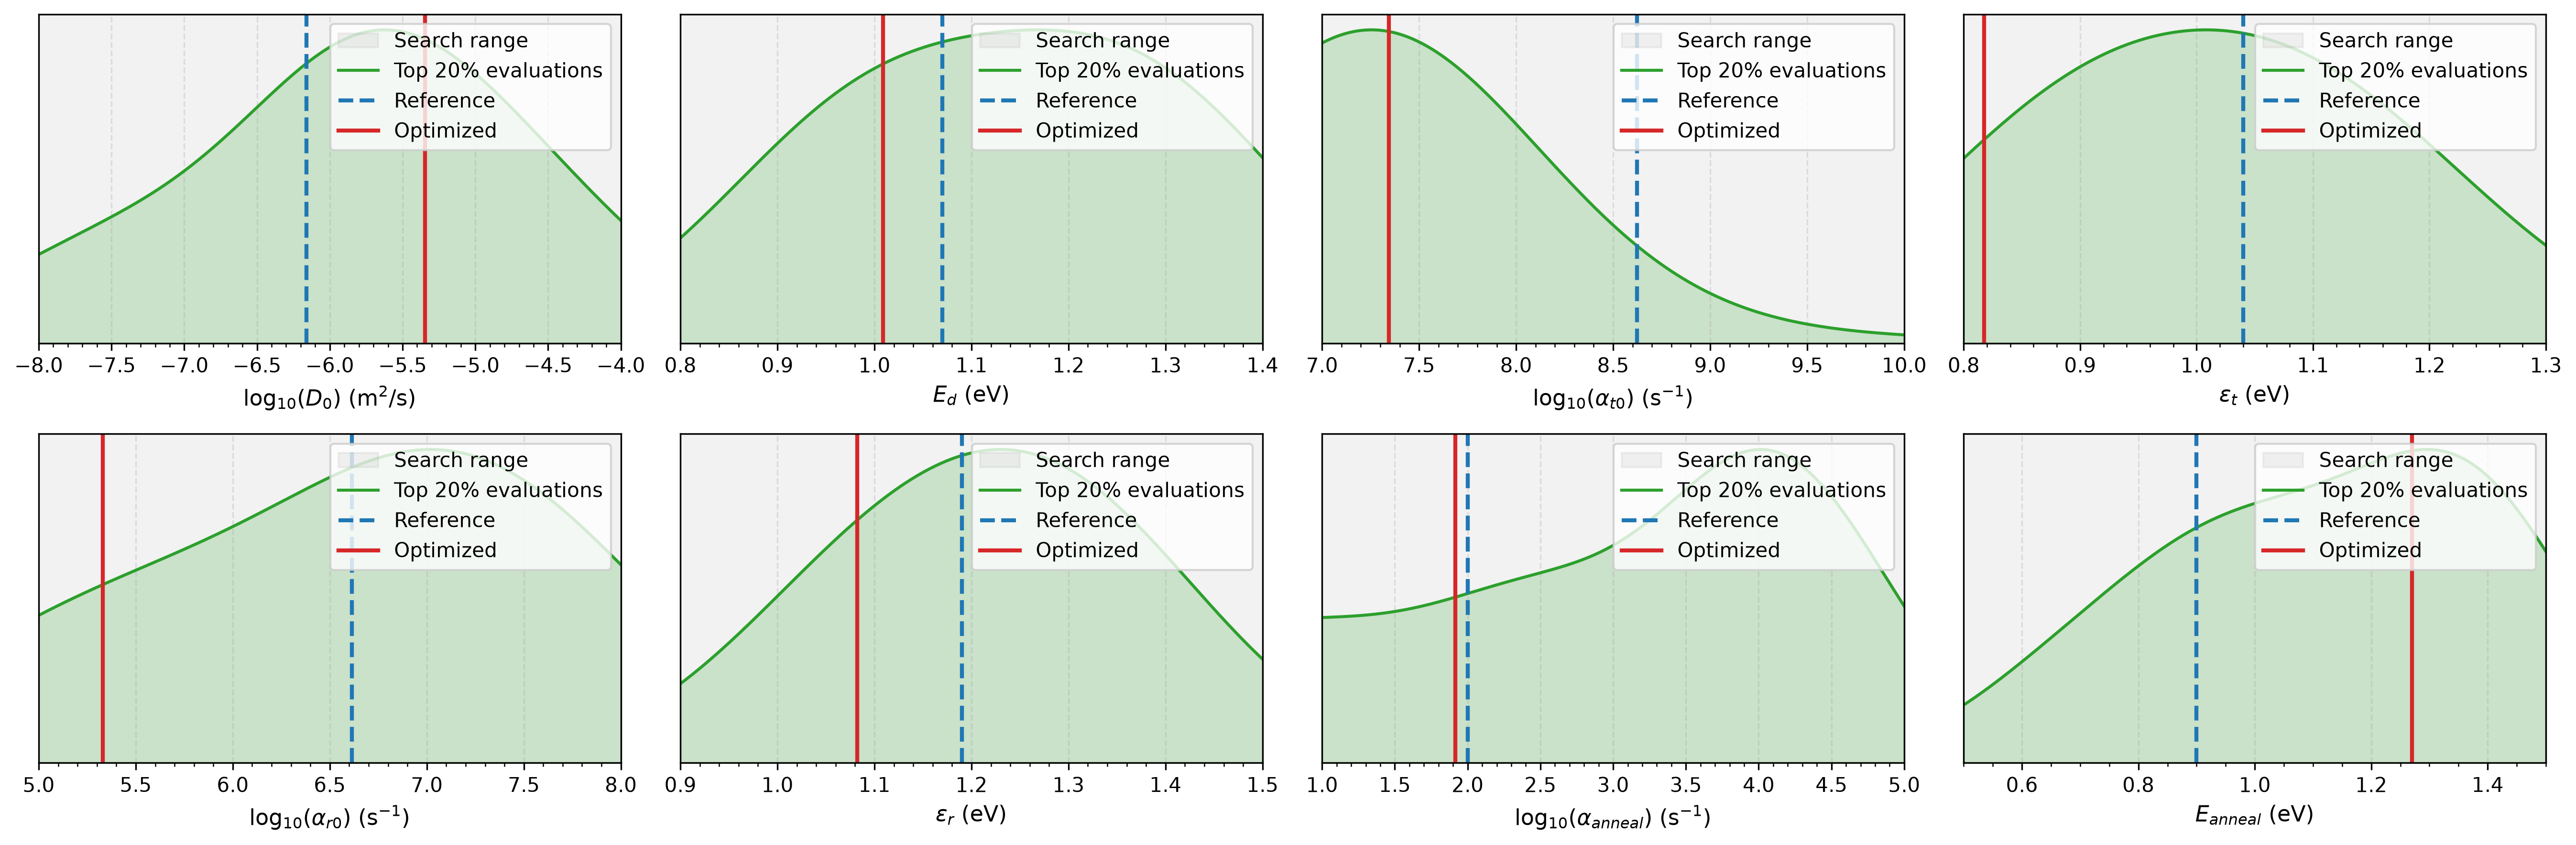
Figure 3: Comparison of reference (blue dashed) and Bayesian-optimized (red solid) parameter values. Green curves show the distribution of the parameters with top 20% RMSPE from the Bayesian optimization. The gray shaded region indicates the search range.
Figure 4 compares the Arrhenius-law temperature dependence of the diffusivity , trapping rate coefficient , detrapping rate coefficient , and annihilation rate coefficient between the reference and optimized parameter sets over the 300–900 K TDS temperature range. The diffusivity pre-exponential factor increases by roughly one order of magnitude while the activation energy remains close to the reference (1.07 to 1.01 eV). The trapping prefactor decreases by about one order of magnitude with a reduced activation energy (1.04 to 0.82 eV), while the detrapping prefactor decreases by about one order of magnitude with a slightly reduced activation energy (1.19 to 1.08 eV). The optimized annihilation prefactor (~83 s) remains close to the reference value (100 s), with the annihilation activation energy increasing from 0.9 to 1.27 eV, further suppressing annihilation effects during TDS.
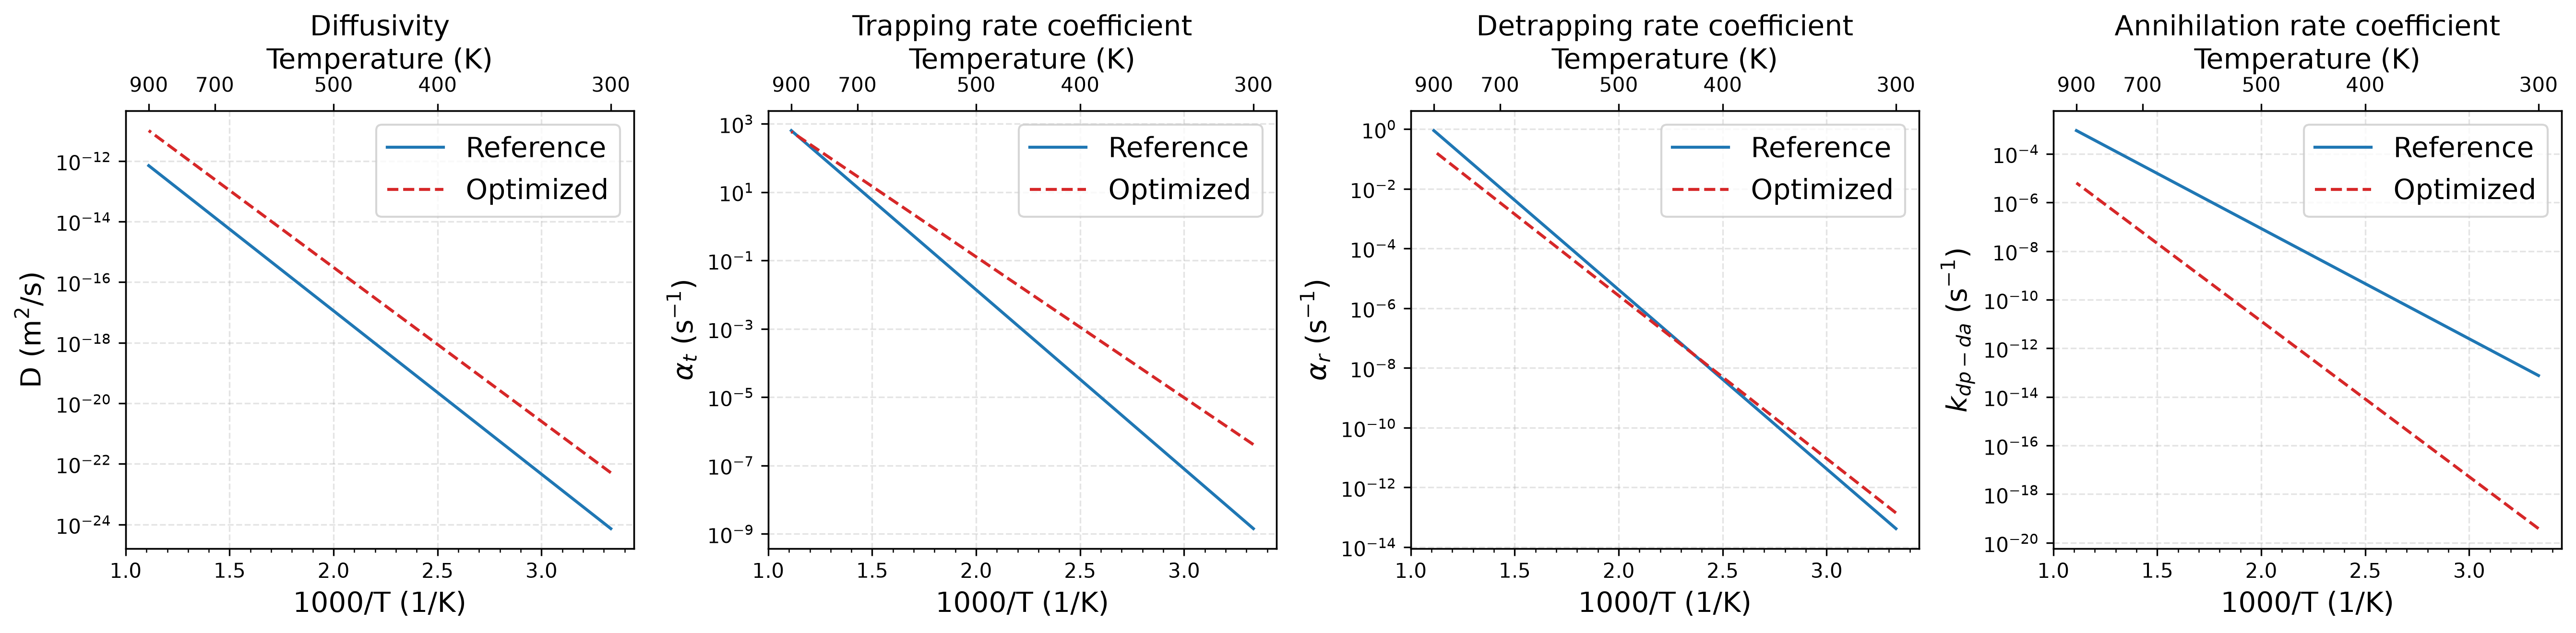
Figure 4: Comparison of Arrhenius temperature dependence for diffusivity, trapping rate, detrapping rate, and annihilation rate between reference and Bayesian-optimized parameter sets.
Figure 5 shows the comparison between TMAP8 with the optimized parameters and the experimental data. The optimized parameters significantly reduce the RMSPE compared to the reference parameters, demonstrating improved agreement with the experimental TDS spectrum.
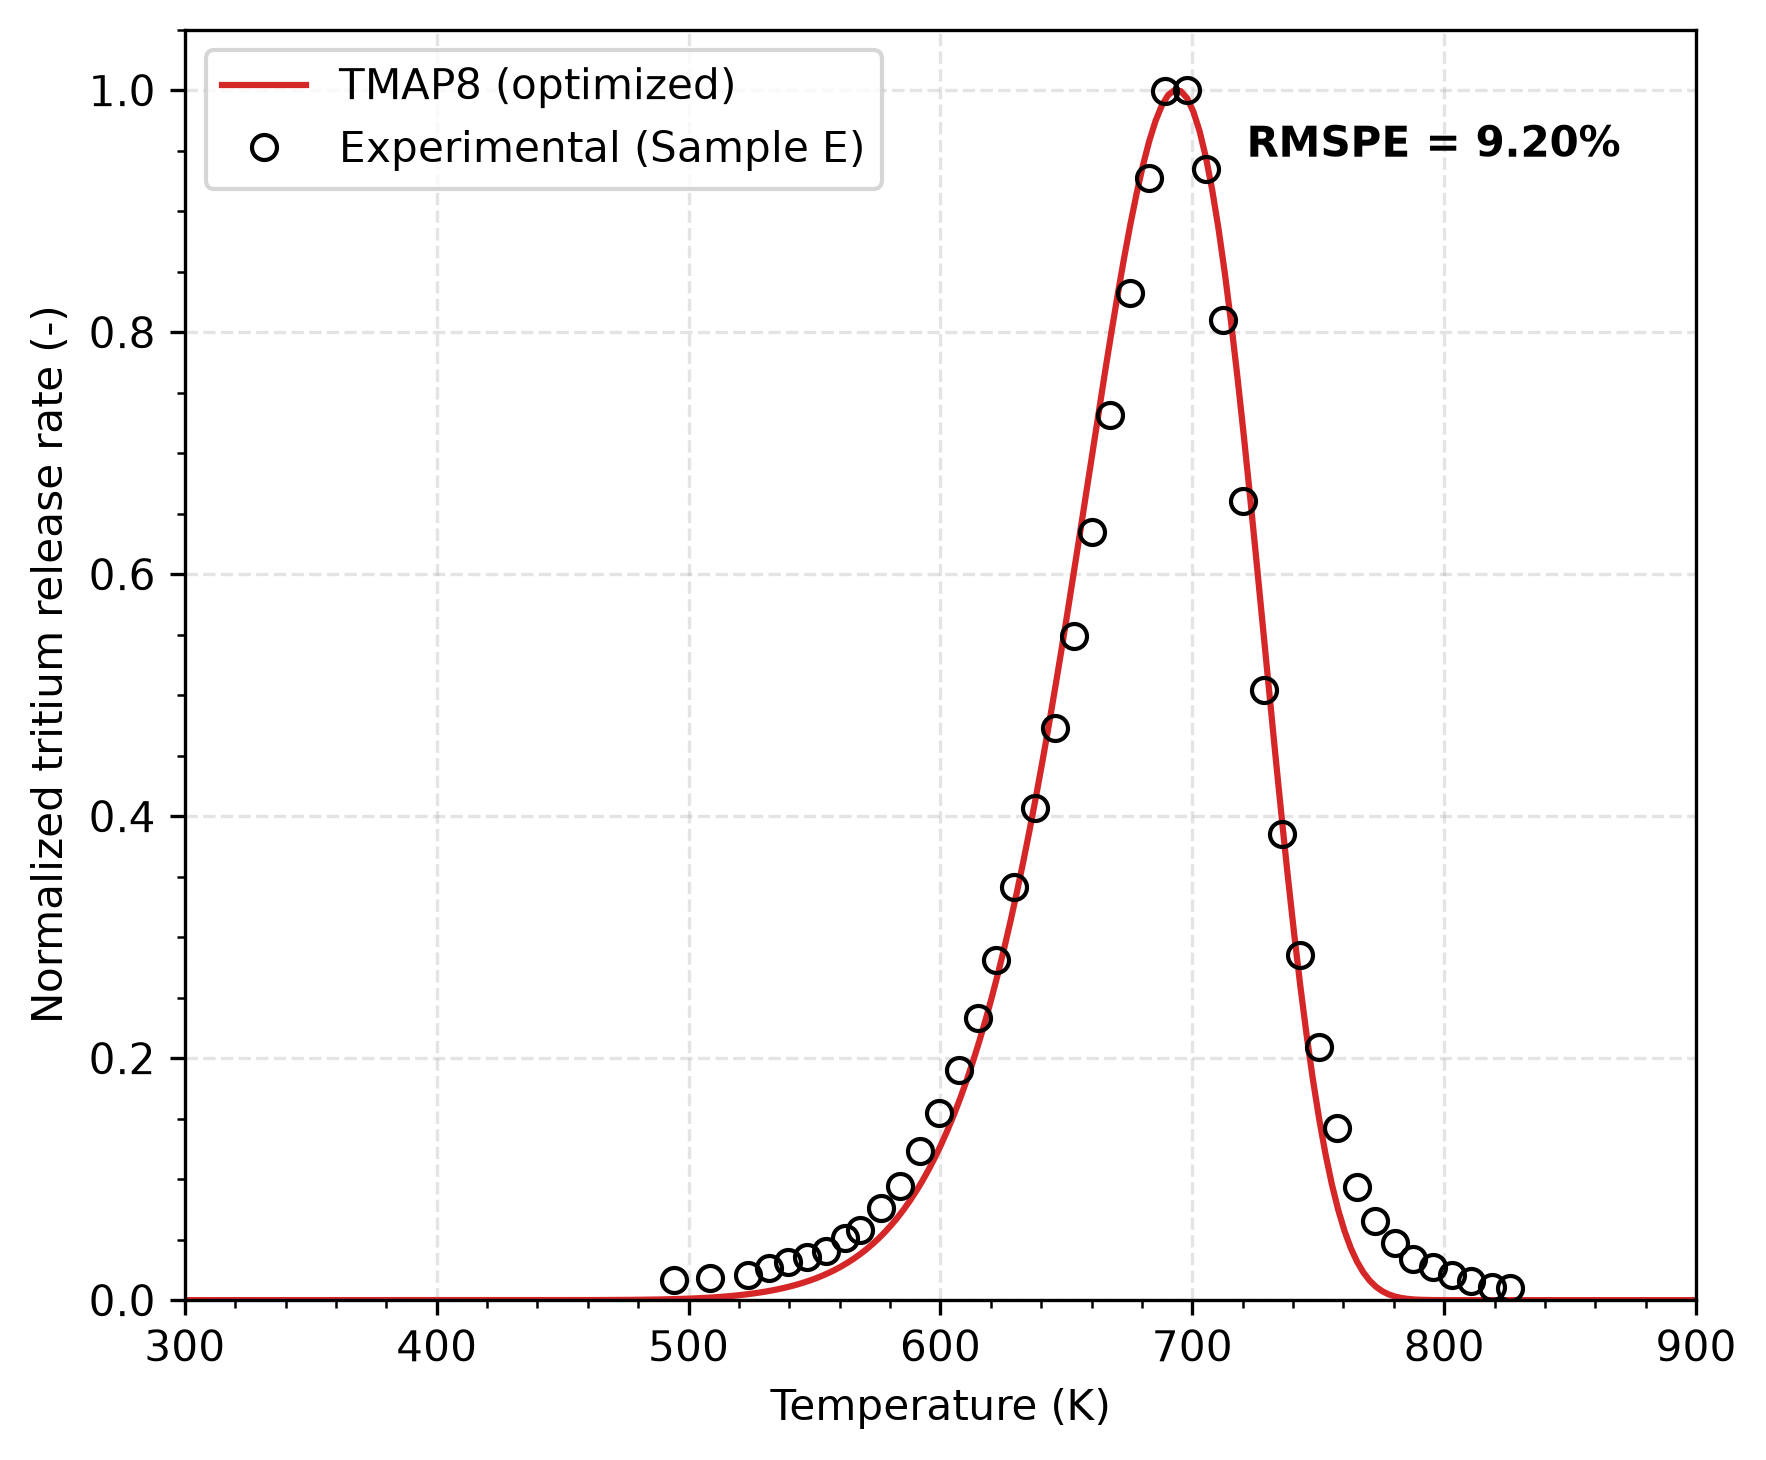
Figure 5: Comparison of TMAP8 calculation with Bayesian-optimized parameters against the experimental TDS data for Sample E (high defect density).
Input files
The input files for this validation case are:
(test/tests/val-2j/val-2j_base.i): Contains the shared simulation blocks (mesh, variables, kernels, materials, etc.) used by all val-2j cases.
(test/tests/val-2j/val-2j.i): Simulates tritium transport in LiTiO spherical sample with reference parameters. (test/tests/val-2j/optimal_bayesian_params.i) overrides with Bayesian-optimized parameters.
(test/tests/val-2j/bayesian_main_val2j.i) and (test/tests/val-2j/val-2j_bayesian.i): The optimization main and sub input files, respectively, for Bayesian parameter optimization.
More information about these tests can be found in the test specification file for this case, namely (test/tests/val-2j/tests).
References
- Somayajulu L.N. Dhulipala, Peter German, Yifeng Che, Zachary M. Prince, Xianjian Xie, Pierre-Clément A. Simon, Vincent M. Labouré, and Hao Yan.
MOOSE ProbML: parallelized probabilistic machine learning and uncertainty quantification for computational energy applications.
Journal of Computational Science, 94:102776, 2026.
URL: https://www.sciencedirect.com/science/article/pii/S1877750325002534, doi:https://doi.org/10.1016/j.jocs.2025.102776.[Export]
- Makoto Kobayashi, Yasuhisa Oya, Kenzo Munakata, and Kenji Okuno.
Developing a tritium release model for LiTiO with irradiation-induced defects.
Journal of Nuclear Materials, 458:22–28, 2015.
doi:10.1016/j.jnucmat.2014.11.047.[Export]