val-2k
Oxide effects on deuterium release from self-irradiated tungsten
Overall Case Description
This validation case is based on the natural-oxide and thin-oxide experiments reported in Kremer et al. (2022). The experimental study performs thermal desorption spectroscopy (TDS) and measures deuterium release from self-irradiated tungsten samples with a natural oxide layer and with electrochemically grown oxide layers between 5 nm and 100 nm. This case uses the same overarching model (e.g., tungsten diffusion, trapping, and surface-release formulation) to capture the deuterium release behavior of four self-irradiated tungsten samples with distinct oxygen-field configurations: natural oxide and 5 nm, 10 nm, and 15 nm thin oxide films. The effect of the thin oxide films on the release is discussed, with the model providing key mechanistic insights into the observed experimental behavior. The release behavior is compared against the time-dependent experimental HD + D and HDO + DO signals as the temperature increases. In the present implementation, those grouped measurements are represented phenomenologically through an explicit D release and an oxygen-gated DO release rather than through separate explicit HD and HDO transport species.
The aim of this study is to understand the effect of the presence of an oxide layer on deuterium retention and release from tungsten samples. While tungsten oxidation is expected to be limited in fusion power plant conditions, it does take place in laboratory environments, which can affect laboratory observations. Understanding oxide effects can thus help better tie laboratory experiments to performance in fusion-relevant environments, thus increasing the impact of laboratory experiments and accelerating fusion energy deployment.
Sample history and dimensions
The reference sample history is taken from Kremer et al. (2022). In the experiment, the 0.8 mm tungsten specimens are first self-irradiated, which generates a self-damaged near-surface region (2.3 m thick). The samples are then loaded with deuterium so that the retained inventory is concentrated in the first few micrometers of the sample. The loading is performed at 370 K to enable deuterium mobility while minimizing defect annealing in the self-damaged region. Once loaded, a thin oxide layer is deposited using an electrochemical process at low temperature. The advantage of this approach is that compared to thermal oxidation, the temperature remains low (e.g., room temperature), which limits deuterium transport and defect annealing. Kremer et al. (2022) note that electro-chemically grown tungsten oxide has an amorphous structure and, therefore, differs from thermally grown oxide or natural oxide, which might affect the release behavior.
While Kremer et al. (2022) offers a wide range of data and observations for oxide-layer thicknesses reaching up to 100 nm, the current study focuses on the thinner oxide films discussed in the experimental paper, namely a sample with a natural oxide layer and then samples with 5 nm, 10 nm, and 15 nm-thick oxide films. The paper describes the natural oxide as being 1-2 nm thick, and the present model uses 1 nm as a representative natural-oxide value for that case. All four desorption calculations start from the same preloaded tungsten state and follow the digitized temperature history from Fig. 6 in Kremer et al. (2022), which heats the sample from about 296 K to about 1000 K over roughly 4.17 h.
The initial deuterium profile used at the start of desorption is shown in Figure 1 for the 15 nm configuration (the same approach is used for the other samples). The shaded regions identify the oxide, damaged tungsten, and bulk tungsten sections in the plotted depth range. In this configuration, most of the retained inventory is placed in the irradiation-induced traps inside the damaged region, while the mobile deuterium concentration remains comparatively negligible.
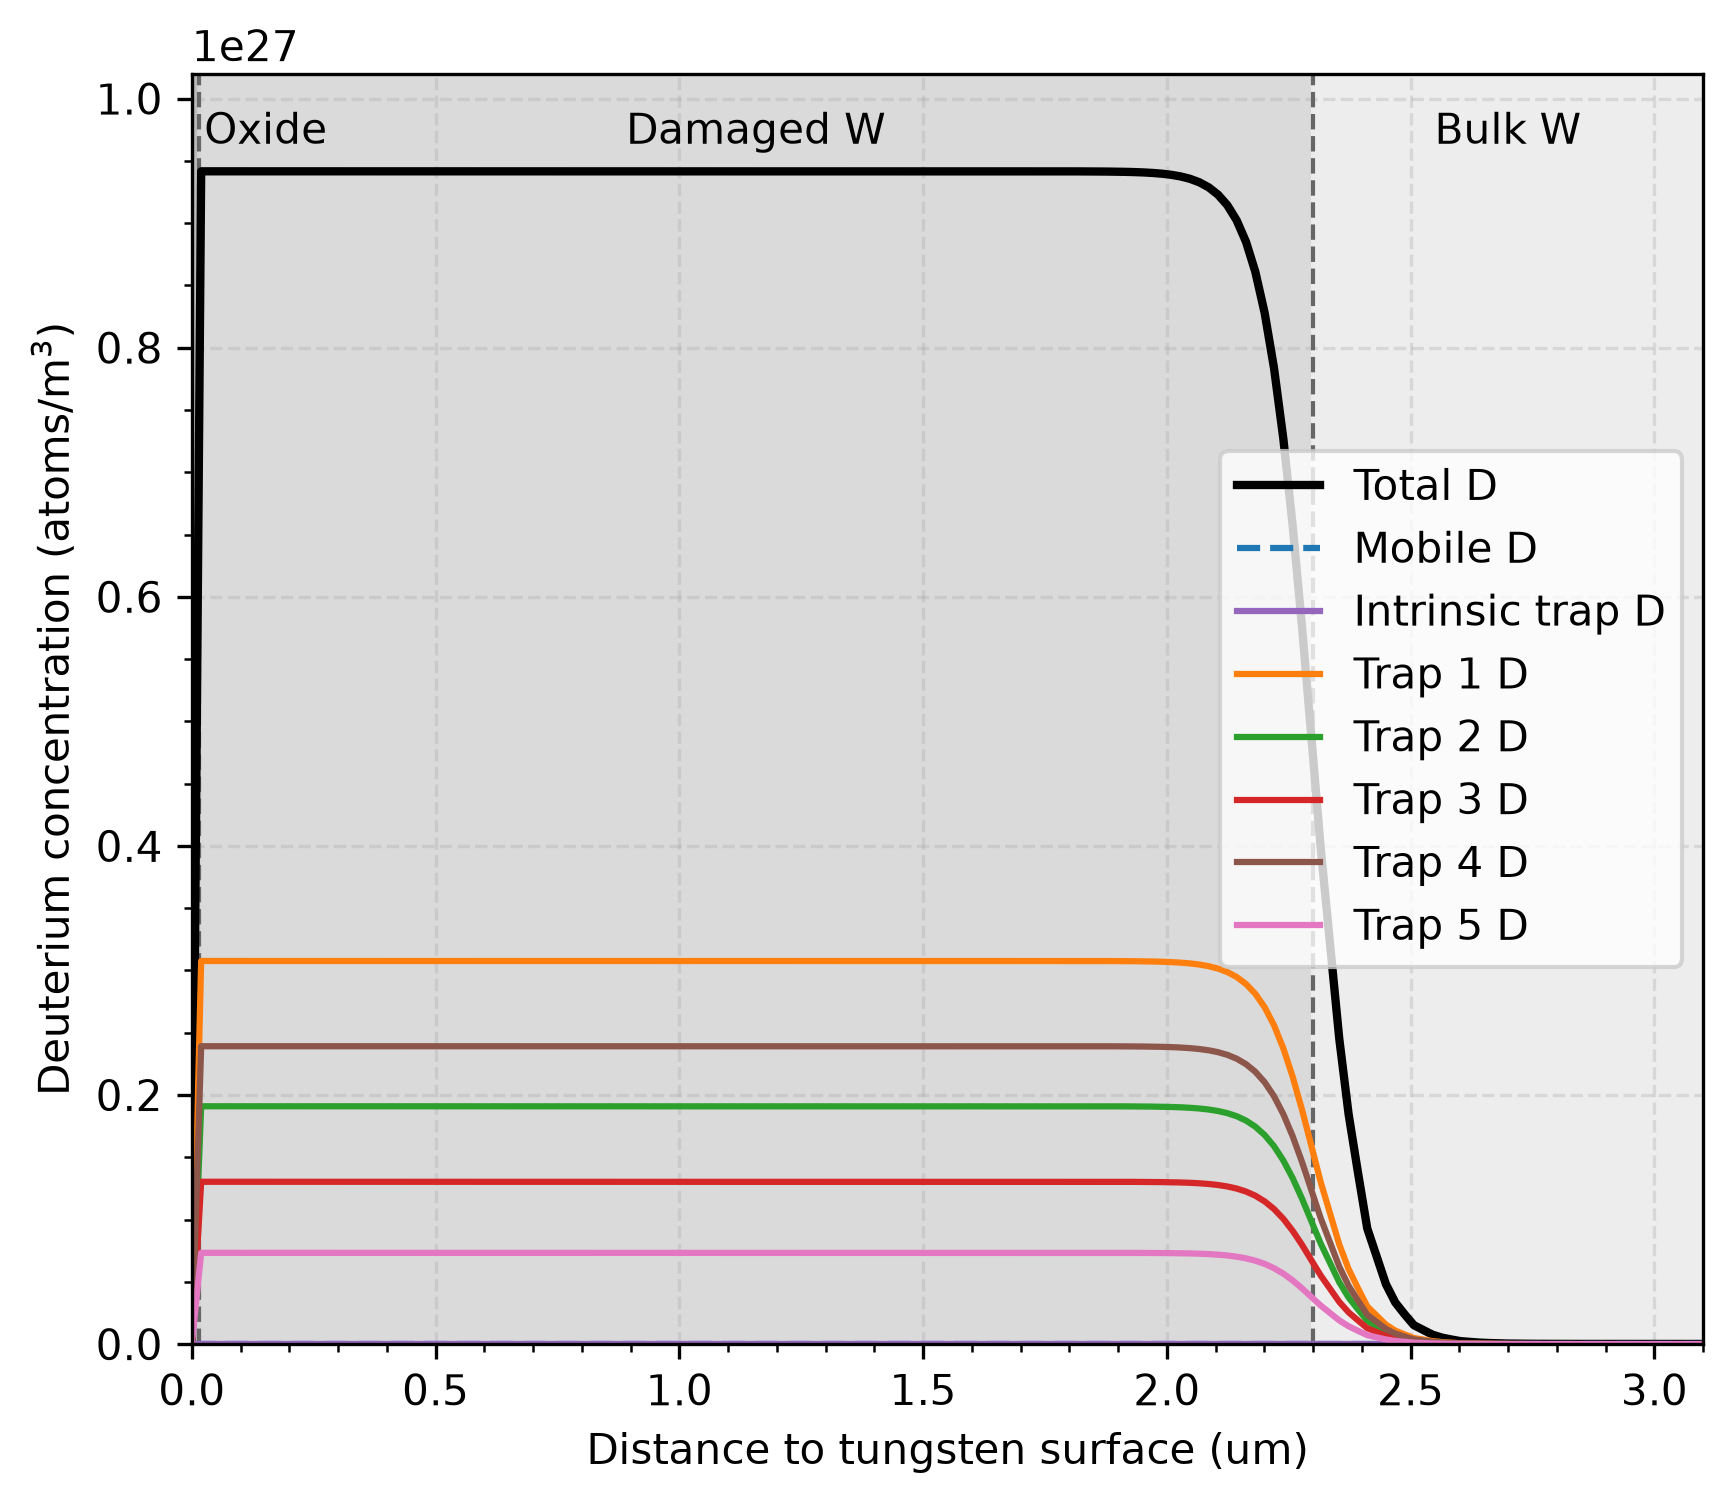
Figure 1: Initial deuterium concentration profile used to start the 15 nm val-2k desorption calculation. The profile shows the mobile deuterium concentration (negligible), the six trapped populations, their total, and the oxide, damaged tungsten, and bulk tungsten sections.
Model Description
To capture the deuterium release behavior from self-irradiated tungsten with a thin oxide film, the model includes the following features:
A one-dimensional geometry with an oxide layer, a self-damaged region, and the tungsten bulk, as illustrated in Figure 1.
Deuterium transport involves Fickian diffusion, trapping and resolution, and surface reactions.
Trapping and resolution are governed by six trap families: one intrinsic trap family and five irradiation-induced trap families. This is directly inspired by val-2f, which validates TMAP8 based on deuterium release from self-irradiated tungsten. The full set of trap site densities is adapted from val-2f so the initial areal inventory matches the prescribed
val-2kpreload.The density of the intrinsic trap, since it is independent of irradiation, is homogeneous in the sample. The densities of irradiation-induced traps, however, are homogeneous in the 2.3 m-thick self-damaged region, and then quickly decrease to 0 in the bulk of the sample with a transition length of 0.05 m. Irradiation-induced trap densities also decrease to 0 in the oxide layer with a transition length of 0.25 nm (see Figure 1).
Deuterium release takes place either as D or as DO by combining with an oxygen atom at the surface. The surface recombination rates of these reactions are different.
The oxide layer is modeled as an additional layer on top of the self-damaged region. The transport properties of deuterium in the oxide layer remain equal to those in tungsten (e.g., same diffusivity), except that no trapping sites are present in the oxide layer. Note that the thickness of the oxygen layer does not evolve in time, even as oxygen atoms are released as DO. These simplifications are considered reasonable as the oxide layer represents only a small volume and thickness in these cases.
The oxide layer is initialized with a given oxygen concentration (consistent across all cases), which is null everywhere else. The diffusivity of oxygen in the oxide layer is accounted for, but the diffusion of oxygen deeper into the tungsten sample is suppressed.
The mesh is refined near the exposed surface. This is to resolve the oxide-to-damaged-tungsten and damaged-to-bulk-tungsten transition and to accurately capture the surface reactions, oxygen transport, and behavior in the self-damaged region. Deeper into the sample, the mesh is coarser to reduce computational size.
The only difference between the four configurations of interest (e.g., natural oxide and 5, 10, and 15 nm-thick oxide films) is the thickness of the oxide layer and the mesh refinement area. The model formulation, other initial conditions, and all the model parameters are consistent across all cases.
As in val-2f, the implementation is solved internally in dimensionless form, but the physical governing equations are written first here for clarity. The mobile deuterium balance is
with one trapped-species evolution equation for each trap family:
where is the mobile deuterium concentration, is the time, is the concentration trapped in family , is the remaining empty trap capacity, is the fraction of host sites that can act as trap family , and is the tungsten host density. is the deuterium diffusivity in tungsten (and tungsten oxide in this model), and and are the trapping and resolution rates for trapping family , respectively.
The oxygen field evolves according to
where is the oxygen concentration and is the oxygen diffusivity in the oxide layer. In the current model, oxygen diffusion is masked so that it is active only inside the oxide layer.
The temperature-dependent diffusivities and trapping/detrapping rates follow Arrhenius forms:
and
for the diffusivities, and
and
for the trapping and detrapping rates.
The surface reactions represented in the model are
which give the corresponding surface fluxes
and
where and are deuterium-atom fluxes leaving the mobile-deuterium balance from and reactions, with units of D atoms m s. Equivalently, the molecular heavy-water flux is , so the oxygen loss flux satisfies because one oxygen atom is consumed per released DO molecule. While the reverse reactions, e.g., molecular dissociation at the surface, are possible, they are neglected here for simplicity due to the low partial pressure of deuterium in the gas surrounding the sample.
The surface reaction rates also follow Arrhenius forms and are defined as
and
For numerical stability, the input files rewrite these equations in dimensionless form using the reference ratios
with m and s. The corresponding dimensionless groups used in the input files are
and
The transient solve is therefore carried out in dimensionless variables, while physical-unit auxiliary variables and postprocessors are written for direct comparison with the experimental TDS data and for generation of the validation figures.
Case and Model Parameters
The literature-based and calibrated model parameters, geometry, and sample history conditions are listed in Table 1. The initial oxygen concentration is derived from the paper-reported removal of O/m from the first 13.5 nm of oxide and is reduced by an additional factor of 1.5 in the current calibrated model, which yields about O/m.
Table 1: Literature-based and calibrated model parameters, geometry, and sample history conditions used in val-2k.
| Parameter | Description | Value | Units | Reference |
|---|---|---|---|---|
| Tungsten thickness | 0.8 | mm | Kremer et al. (2022) | |
| Oxide thickness | 1, 5, 10, 15 | nm | Natural-oxide proxy plus explicit thin-film cases from Kremer et al. (2022) | |
| Tanh transition width used for oxide-to-W blending | 0.25 | nm | Numerical resolution choice | |
| Self-damaged depth | 2.3 | m | Kremer et al. (2022) | |
| Initial desorption temperature | 295.775 | K | Digitized from Fig. 6 in Kremer et al. (2022) | |
| Final desorption temperature | 1001.408 | K | Digitized from Fig. 6 in Kremer et al. (2022) | |
| Final desorption time | 4.166 | h | Digitized from Fig. 6 in Kremer et al. (2022) | |
| Deuterium diffusivity prefactor | 1.6 | m/s | From val-2f | |
| Deuterium diffusion activation energy | 0.28 | eV | From val-2f | |
| Oxygen diffusivity prefactor in oxide film | 2.0 | m/s | Calibrated, starting from Jiang and Carter (2009) | |
| Oxygen diffusion activation energy in oxide film | 0.45 | eV | Calibrated, starting from Jiang and Carter (2009) | |
| Initial oxygen concentration in oxide film | 4.94 | at/m | Adapted from the oxygen areal density from Kremer et al. (2021) | |
| Tanh transition width used for damaged-to-bulk W blending | 0.05 | m | Numerical resolution choice | |
| Reference length for the dimensionless solve | 1 | m | Chosen to match the val-2f dimensionless formulation | |
| Reference time for the dimensionless solve | 1 | s | Chosen to match the val-2f dimensionless formulation | |
| Mobile reference concentration | 6.3222 | at/m | From val-2f | |
| Intrinsic-trap reference concentration | 6.3222 | at/m | From val-2f | |
| Non-intrinsic trap reference concentration | 6.3222 | at/m | From val-2f | |
| Uniform trap-density scale factor | 6.644848 | - | Chosen so the six-trap model matches the prior val-2k initial areal inventory | |
| Intrinsic detrapping energy | 1.08 | eV | Adapted from val-2f | |
| Trap 1 detrapping energy | 1.20 | eV | Adapted from val-2f | |
| Trap 2 detrapping energy | 1.38 | eV | Adapted from val-2f | |
| Trap 3 detrapping energy | 1.65 | eV | From val-2f | |
| Trap 4 detrapping energy | 1.85 | eV | From val-2f | |
| Trap 5 detrapping energy | 2.05 | eV | From val-2f | |
| Intrinsic trap site density | 1.595 | at/m | Scaled from val-2f | |
| Trap 1 site density | 3.076 | at/m | Scaled from val-2f | |
| Trap 2 site density | 1.910 | at/m | Scaled from val-2f | |
| Trap 3 site density | 1.304 | at/m | Scaled from val-2f | |
| Trap 4 site density | 2.392 | at/m | Adapted from val-2f | |
| Trap 5 site density | 7.330 | at/m | Adapted from val-2f | |
| Recombination prefactor | 3.8 | m/at/s | Adapted from val-2f | |
| Recombination activation energy | 0.34 | eV | Adapted from val-2f | |
| DO surface-release prefactor | 3.8 | m/at/s | Calibrated | |
| DO surface-release activation energy | 2.10 | eV | Calibrated |
Results
The main interpretation from Kremer et al. (2022) is that the oxide film acts both as a deuterium reservoir and as a transport barrier, delaying release as the oxide gets thicker. The paper also reports that chemical interaction between outgassing deuterium and the oxide begins above about 475 K, and that heavy-water release dominates above about 700 K while enough oxide remains available. The calibrated val-2k model is evaluated against those trends as well as against the digitized TDS curves.
Figure 2 compares the deuterium release behavior of all four oxide-layer configurations against the digitized HD + D and HDO + DO desorption data from Fig. 6 of Kremer et al. (2022). The figure also overlays the digitized temperature history from the TDS experiment. In all release figures, the experimental curves come from digitized grouped measurements in the paper, while the simulation curves come from the present calibrated model and are reported as deuterium-atom release rates to match the plotted grouped signals. While Figure 2 shows the experimentally measured and simulated D and DO release curves for all four configurations, Figure 3, Figure 4, Figure 5, and Figure 6 show a subset of the same data by focusing, for clarity, on the natural oxide case and the 5 nm, 10 nm, and 15 nm-thick oxide-film cases, respectively. This makes it easier to inspect the onset temperature, peak placement, D/DO balance, and general trends for each oxide thickness without visual crowding from the other three cases.
 for all four oxide thicknesses.](figures/val-2k_comparison.png)
Figure 2: Comparison of the D and DO release simulation predictions against TDS experimental measurements from Kremer et al. (2022) for all four oxide thicknesses.
 for the natural-oxide case, represented here with a 1 nm oxide layer. The data is a subset of the data in [val-2k_comparison].](figures/val-2k_natural_oxide_case_comparison.png)
Figure 3: Focused comparison of the D and DO release simulation predictions against TDS experimental measurements from Kremer et al. (2022) for the natural-oxide case, represented here with a 1 nm oxide layer. The data is a subset of the data in Figure 2.
 for the 5 nm-thick oxide case. The data is a subset of the data in [val-2k_comparison].](figures/val-2k_5nm_oxide_case_comparison.png)
Figure 4: Focused comparison of the D and DO release simulation predictions against TDS experimental measurements from Kremer et al. (2022) for the 5 nm-thick oxide case. The data is a subset of the data in Figure 2.
 for the 10 nm-thick oxide case. The data is a subset of the data in [val-2k_comparison].](figures/val-2k_10nm_oxide_case_comparison.png)
Figure 5: Focused comparison of the D and DO release simulation predictions against TDS experimental measurements from Kremer et al. (2022) for the 10 nm-thick oxide case. The data is a subset of the data in Figure 2.
 for the 15 nm-thick oxide case. The data is a subset of the data in [val-2k_comparison].](figures/val-2k_15nm_oxide_case_comparison.png)
Figure 6: Focused comparison of the D and DO release simulation predictions against TDS experimental measurements from Kremer et al. (2022) for the 15 nm-thick oxide case. The data is a subset of the data in Figure 2.
In the case of the natural oxide shown in Figure 3, the deuterium release is dominated by D release with two main peaks dictated by the trapping energies. This is consistent with the results discussed in val-2f and Dark et al. (2024). The low release in DO form is attributed to the lower availability of oxygen, since the 1 nm natural-oxide inventory quickly gets depleted, as shown in Figure 7. The model captures the main trends observed experimentally. The position and magnitude of the two peaks for D release are predicted, as well as the ratio of D to DO release. The main difference in trends is the short peak in DO instead of the wider peak observed experimentally. This could be attributed to an overestimation of the oxygen availability or DO surface reaction rate at lower temperatures.
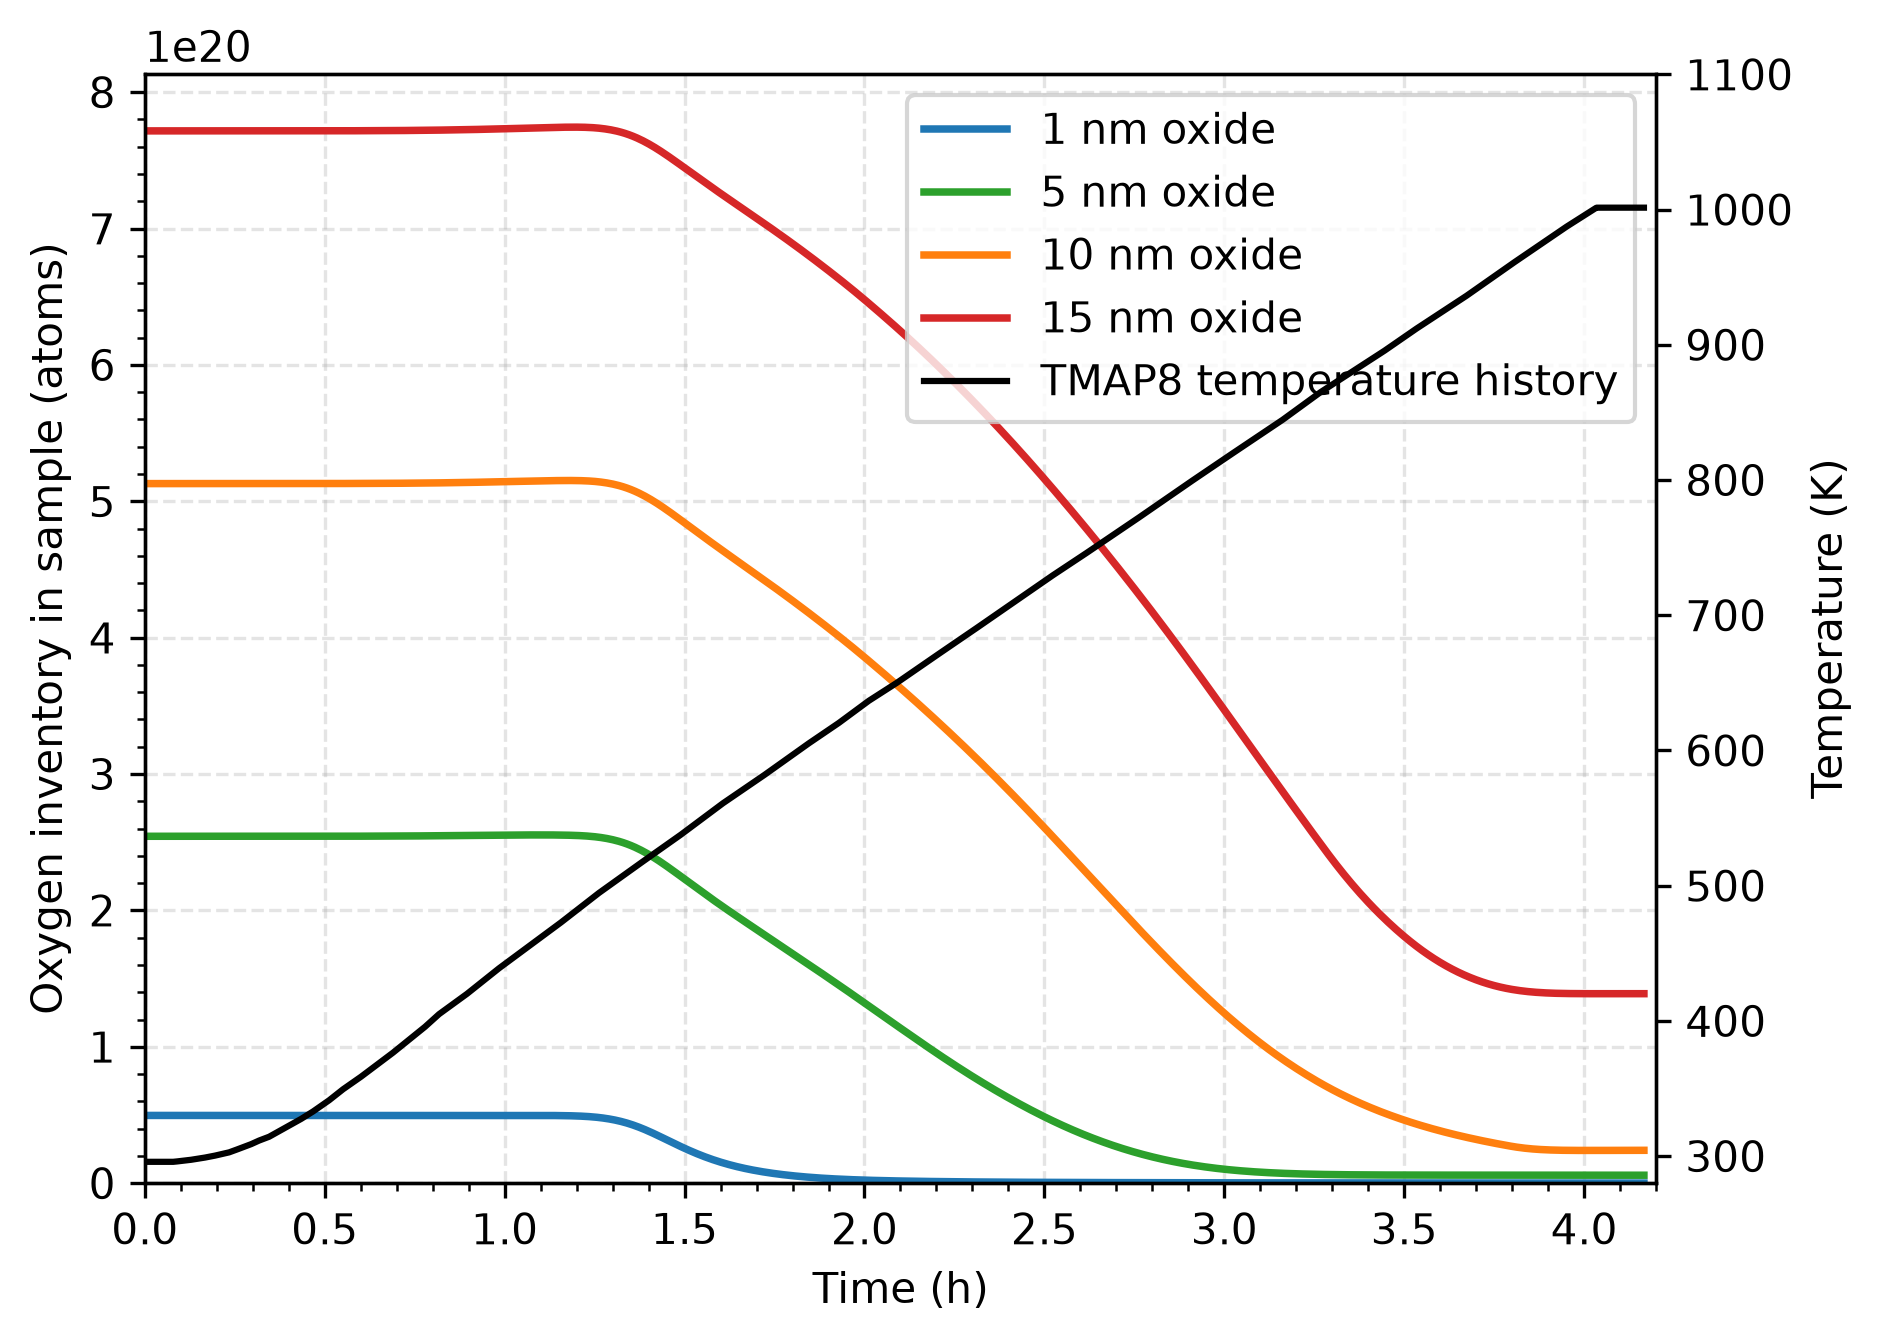
Figure 7: Total oxygen inventory remaining in the sample over time.
Figure 8 shows the evolution of the deuterium inventory as a mobile species and in each trap over time. The deuterium release is dominated by the trapping populations, while the mobile deuterium inventory remains much smaller throughout the desorption ramp, as mobile deuterium quickly reacts at the surface of the sample. The lower-energy traps begin to empty first as the temperature rises, followed by the deeper trap populations later in the ramp, as expected. This behavior is found to be common to all four cases, with no significant effect of the oxide thickness on the detrapping behavior. This is expected since the traps description is common across all cases.
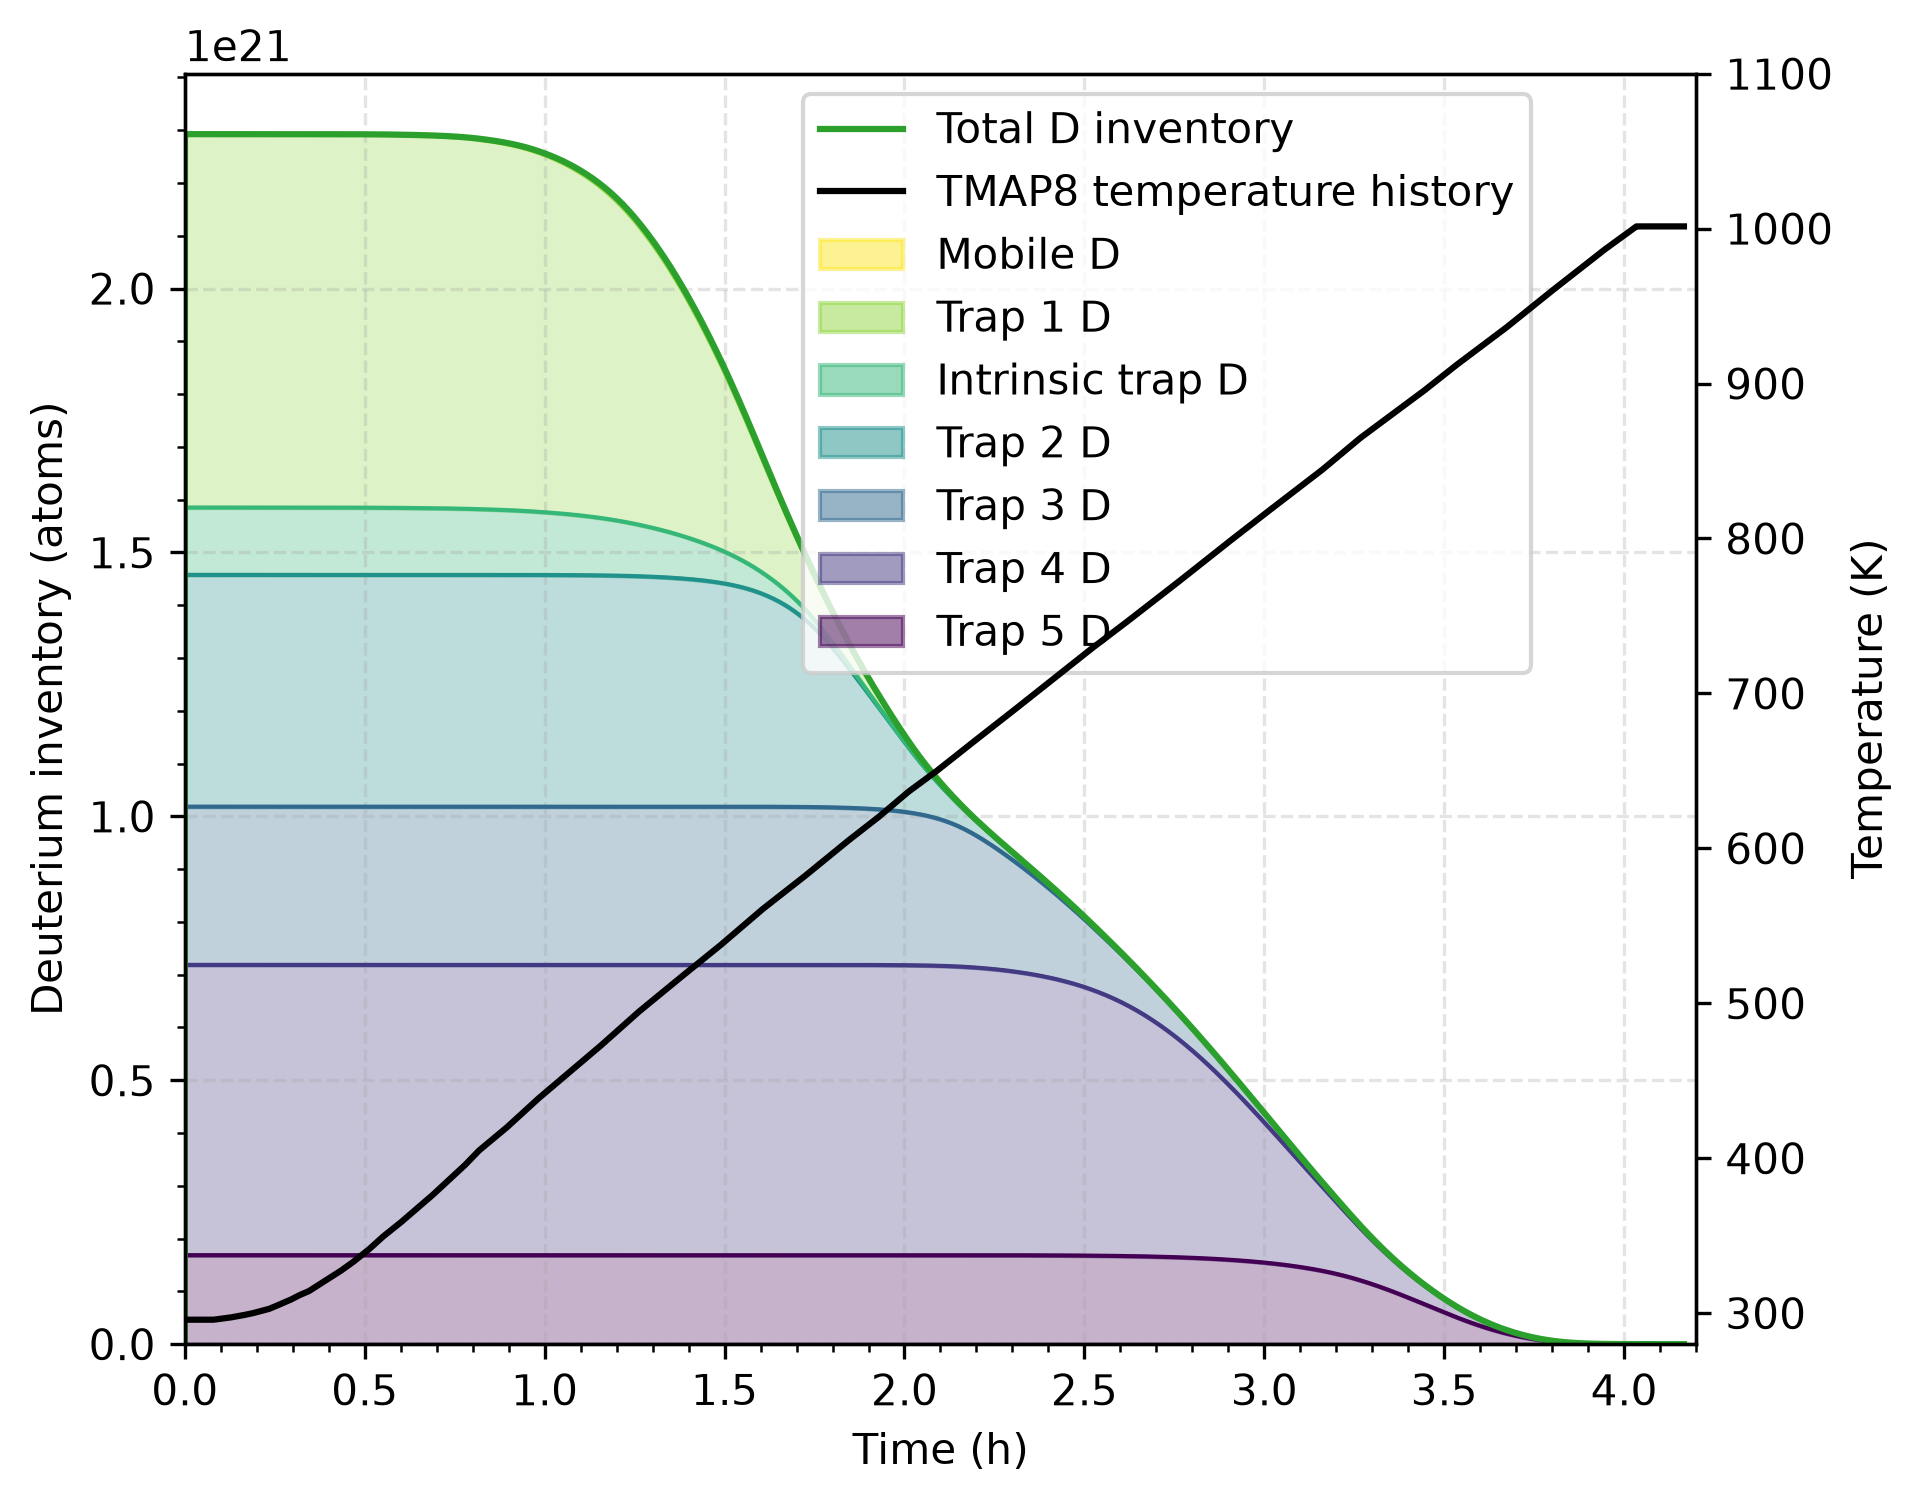
Figure 8: Evolution of the mobile and trapped deuterium inventories during desorption for the 1 nm natural-oxide sample. This behavior is common to all four cases.
As the oxide film thickness increases, the following trends are observable experimentally in Figure 2:
The ratio of DO release over D increases as oxygen availability increases.
The low-temperature D peak maintains its position, but its magnitude decreases consistently.
The high-temperature peak shifts to higher temperatures and its magnitude decreases, even disappearing when the oxide thickness increases from 10 nm to 15 nm.
The DO release increases, with a first peak aligned with the first D peak, then a stable region, and then either a decrease in the case of the 5 nm-thick oxide or another peak aligned with the second D peak for thicker oxides. This secondary DO peak for the 10 nm oxide decreases sooner than for the 15 nm oxide.
These trends are all qualitatively captured by the calibrated model. Furthermore, even if the model lacks a purely mechanistic description of the deuterium and oxide behavior, the simulations offer some physical insights explaining these observed trends.
Oxygen availability was found to be a key parameter during model calibration. As the oxide thickness increases and the oxygen inventory increases (see Figure 7), the ratio of D to DO release decreases. Then, as the oxygen inventory gets depleted, DO release naturally decreases. This helps explain the lack of a secondary peak in DO release for the 5 nm oxide sample, as well as the thinner secondary DO peak for the 10 nm oxide sample compared with the 15 nm oxide sample. As described in Kremer et al. (2022), the oxide layer disappears during TDS for most cases, but some remains for the 15 nm-thick oxide film case (see Figure 7). Note that while no oxide was observed after TDS for the 10 nm sample, the simulation predicts some remaining inventory, albeit only a small fraction of the initial amount. The oxide is completely gone for the natural oxide and 5 nm-thickness cases in both experiments and simulations.
For oxygen to be effectively used for DO release, however, the ratio of the D and DO surface reaction rates must be advantageous, and the oxygen diffusion in the oxide layer needs to be sufficient. The slight delay in the onset in DO release at low temperature compared to D release is captured by a lower DO surface reaction rate at low temperature. However, at high temperature, the surface reaction rate of DO needs to surpass that of D to observe the suppression of the secondary D peak in favor of the secondary DO peak. Figure 9 shows the two phenomenological surface-release coefficients over the experimental desorption temperature window. In the calibrated parameter set, the DO release is strongly suppressed at low temperature by its larger activation energy, then rises more steeply and overtakes the D coefficient at about 520 K, enabling the behavior discussed above.
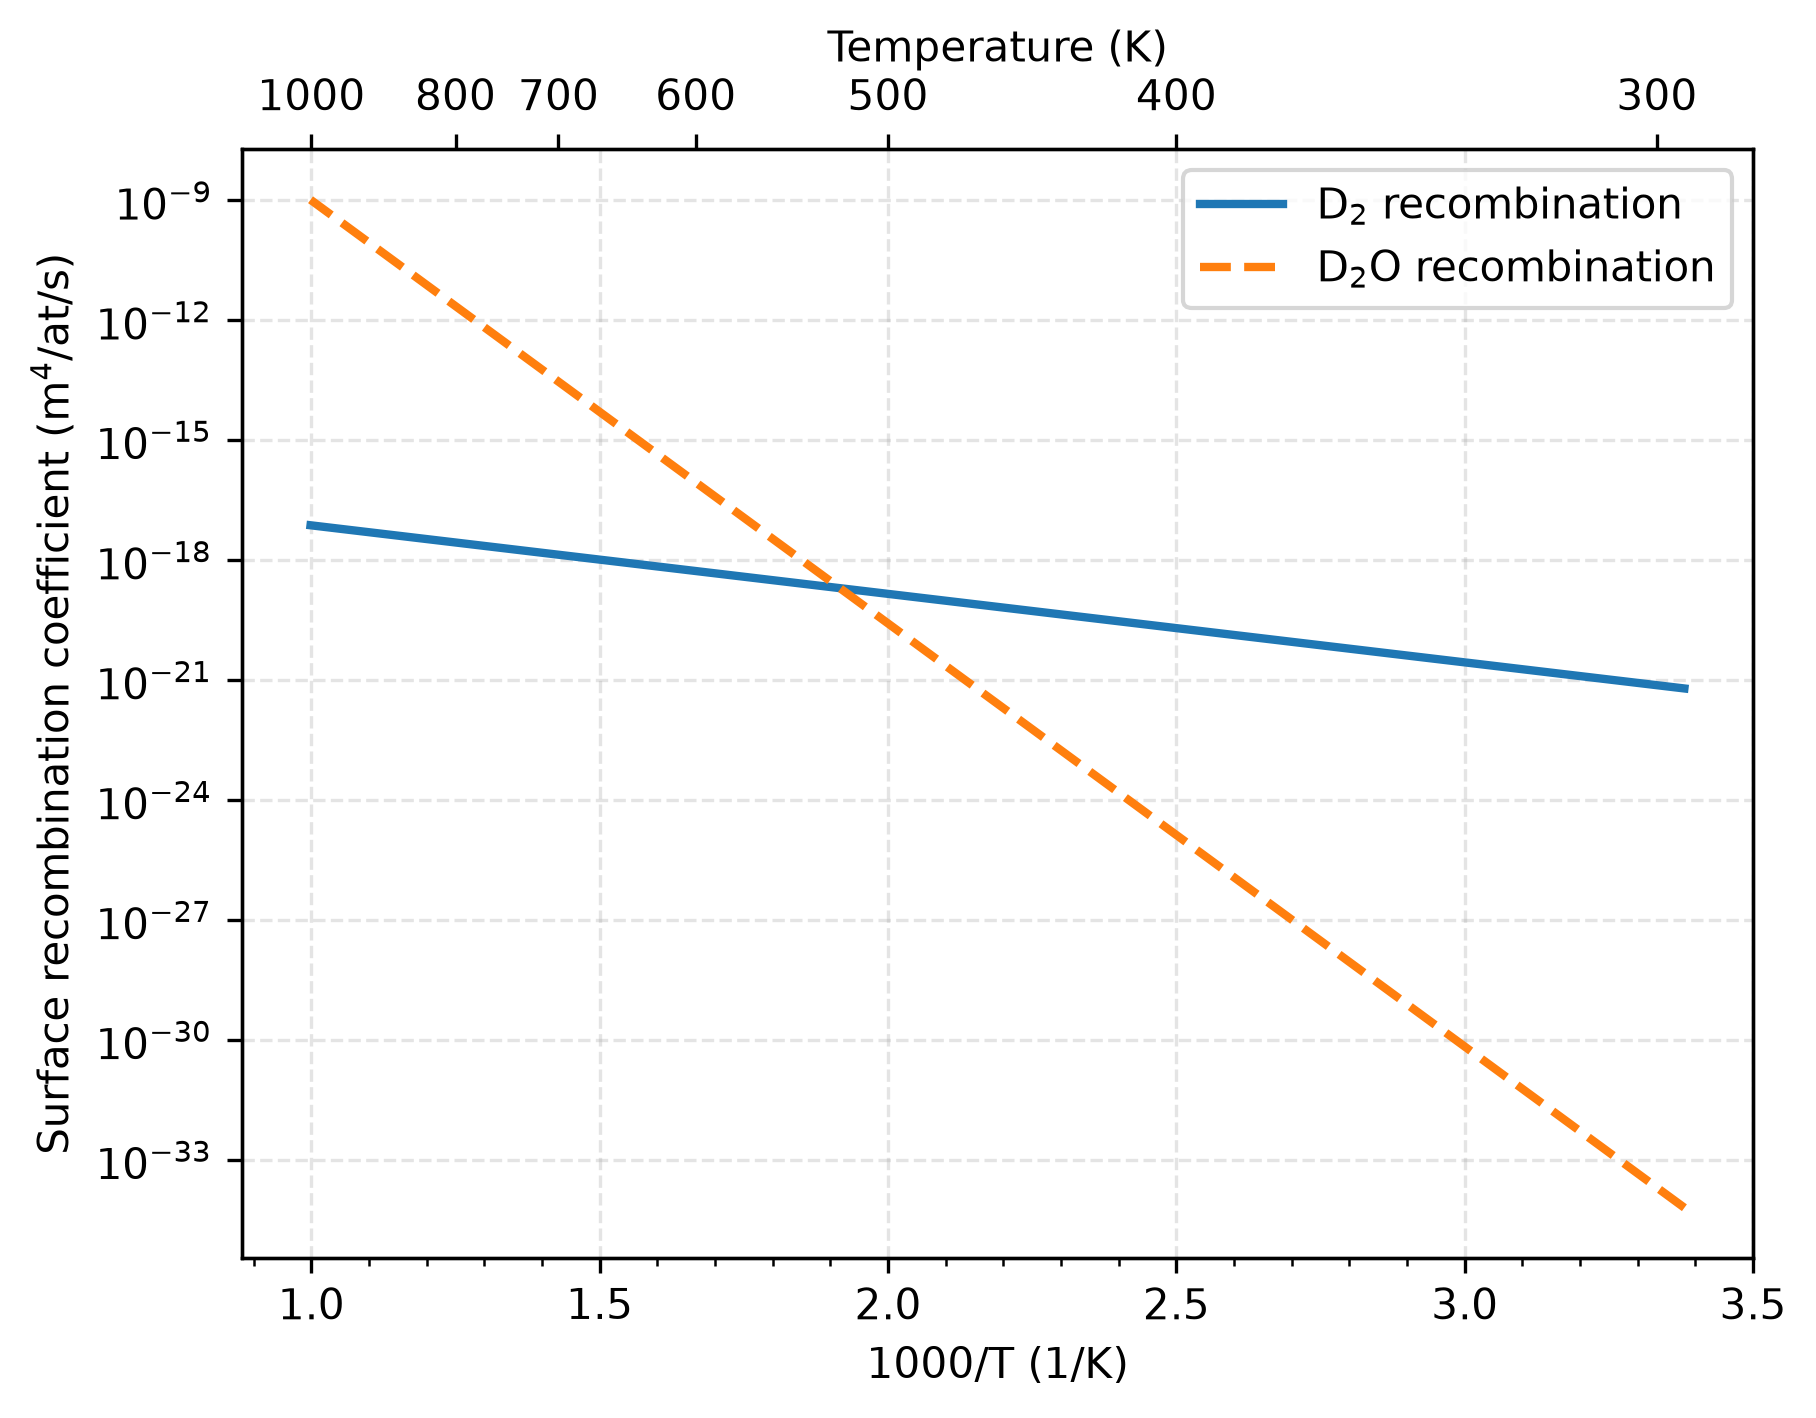
Figure 9: Arrhenius-form surface recombination coefficients used for the D and DO release reactions.
In the case of the 15 nm-thick oxide, the secondary D peak is not completely suppressed in the current model. However, this might be resolved with further model calibration.
To check the numerical accuracy of the simulation presented here, the mass conservation of deuterium and oxygen are computed. Figure 10 tracks the deuterium mass-balance residual normalized by the initial deuterium inventory for every currently available modeled case. The residual is formed from the change in deuterium retained in the sample plus the time-integrated left and right surface release fluxes, so values close to zero indicate mass conservation, which is the case here.
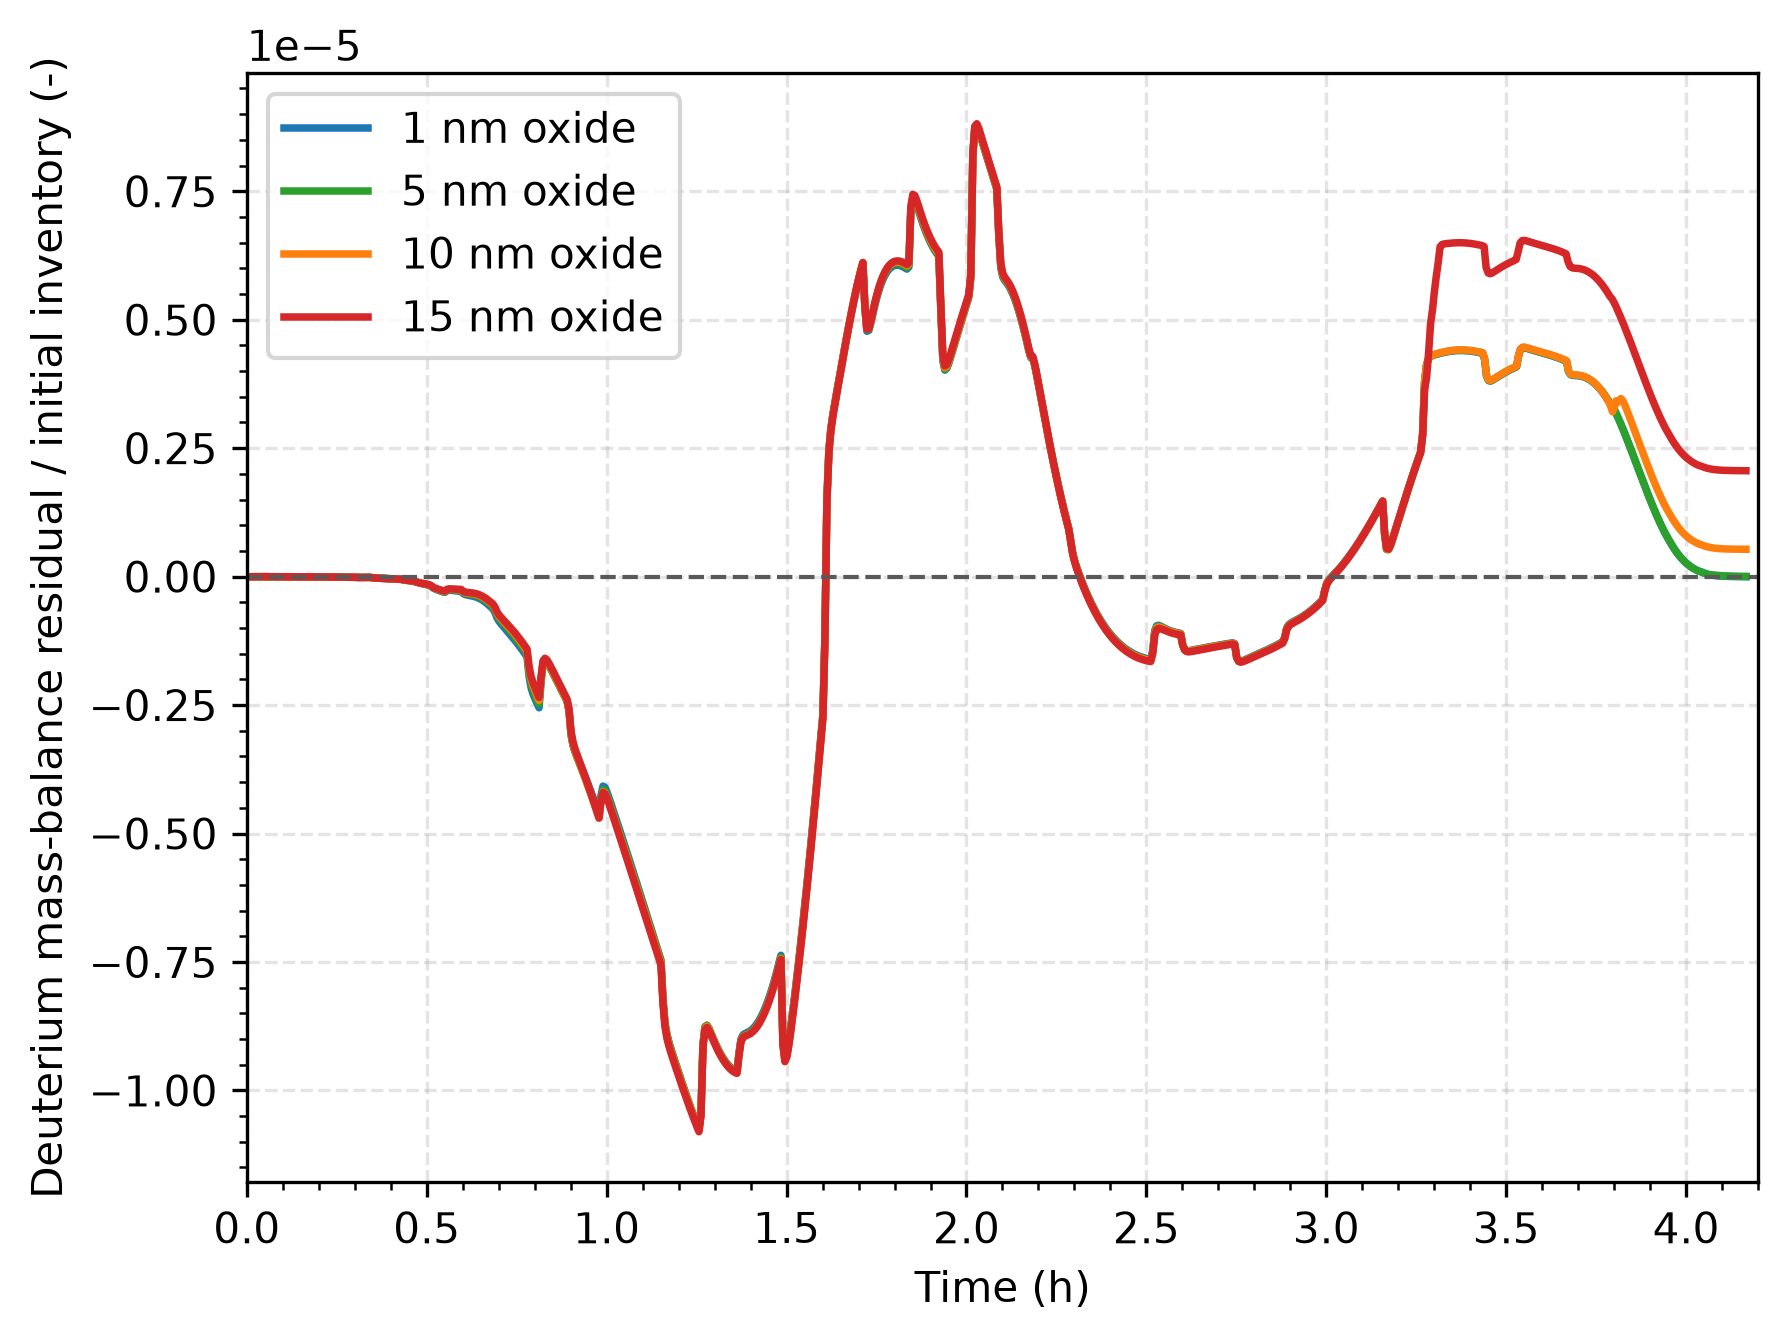
Figure 10: Relative deuterium mass-balance residual over time for all four cases, which shows that mass conservation errors are below reasonable limits.
Figure 11 tracks the oxygen conservation residual normalized by the initial oxygen inventory in each available oxygen-field case. The residual is formed from the change in oxygen retained in the sample plus the time-integrated oxygen loss tied to DO release, so values close to zero indicate mass conservation, which is the case here.
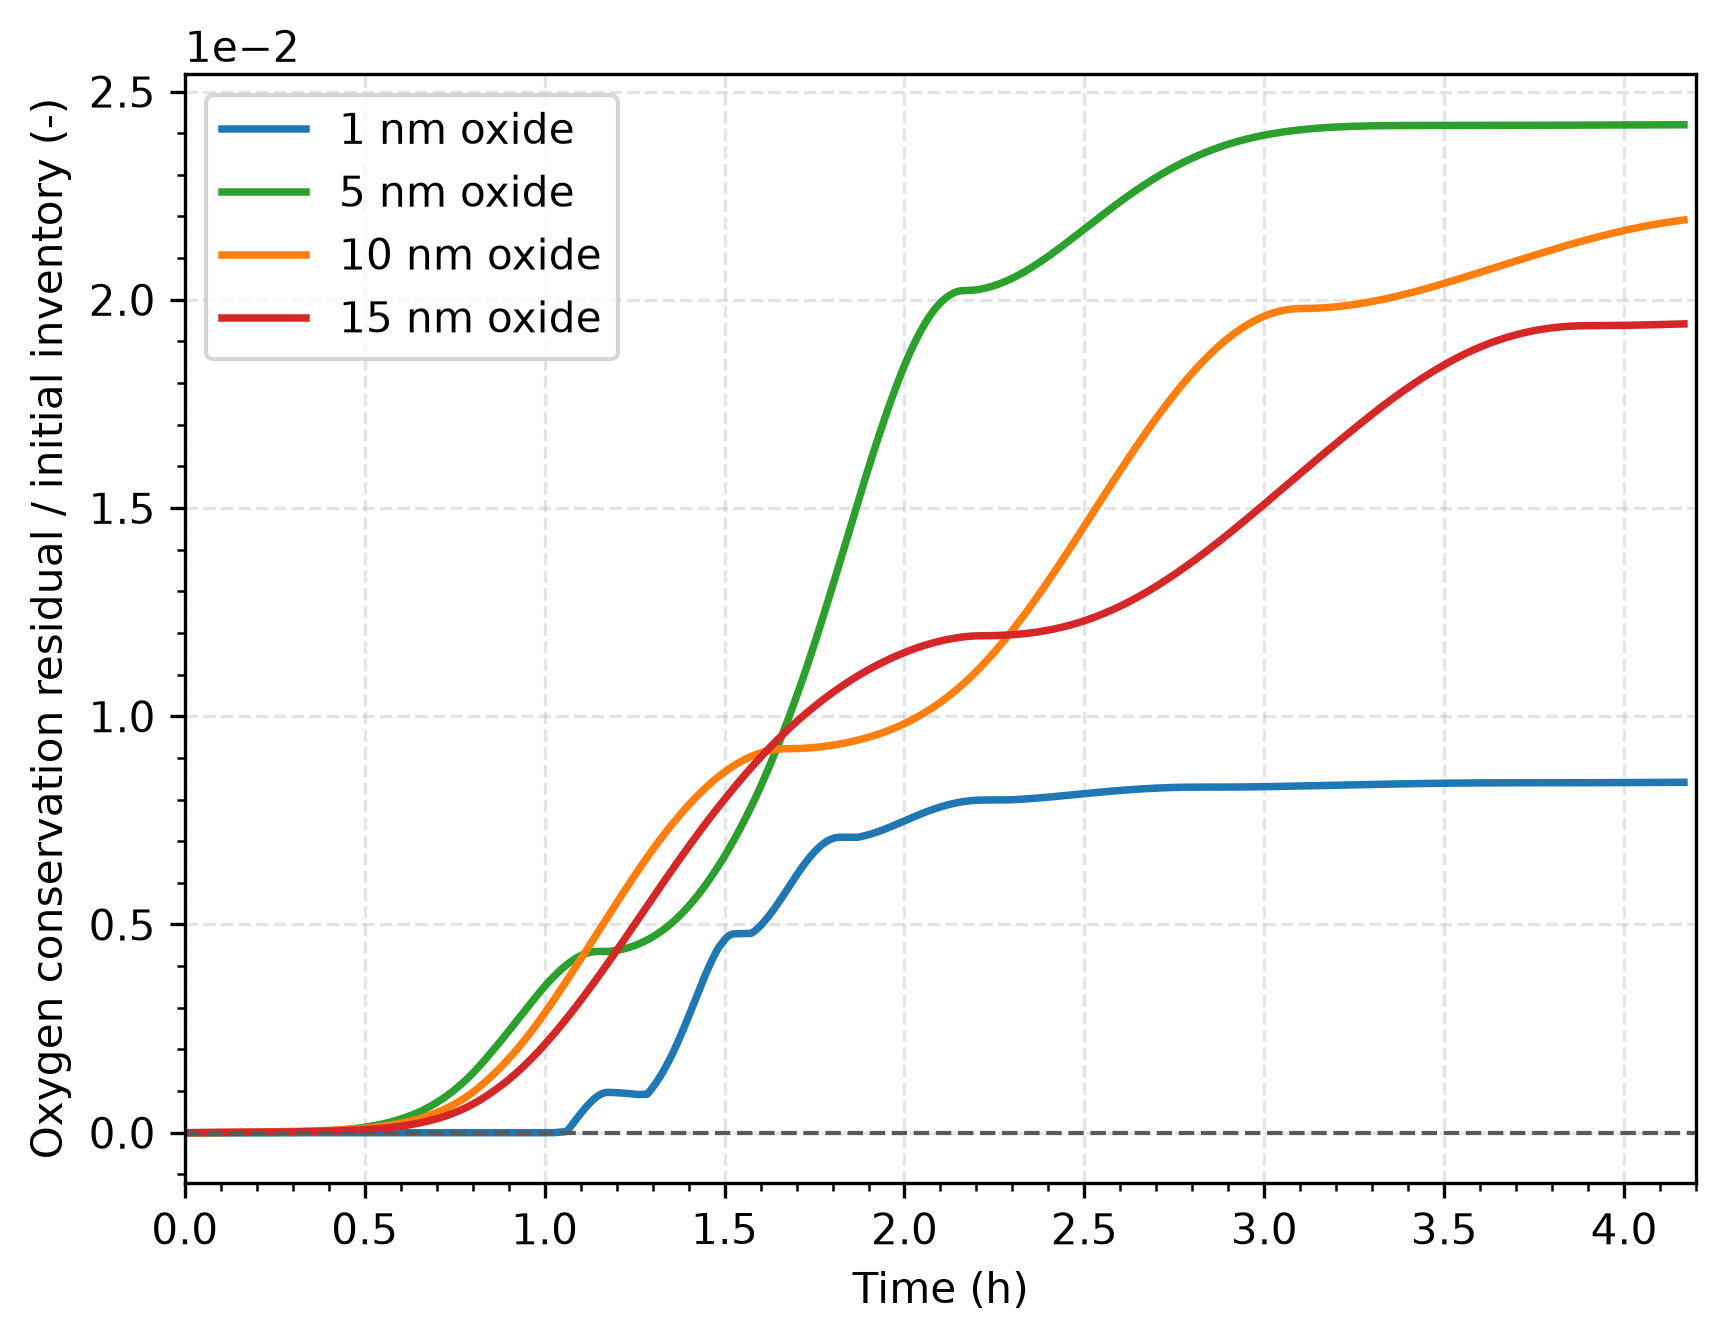
Figure 11: Relative oxygen conservation residual over time for all four cases, which shows that mass conservation errors are below reasonable limits.
Discussion and future work
The model proposed herein uses a general formulation and consistent parameters for all four samples with different oxide thicknesses, and qualitatively captures the main experimentally-observed trends and differences between all configurations published in Kremer et al. (2022). By doing so, it provides key physical insights into the experimental measurements and observations. This insight is valuable to tie laboratory observations, where tungsten oxidation often takes place, to performance in fusion power plant environments. Using this novel model, the laboratory deuterium TDS data can be analyzed and the effect of the oxide layer can be isolated, hence providing a model applicable to fusion energy system conditions.
This model, however, has limitations that should be addressed by future work. The limitations discussed in Kremer et al. (2022) (e.g., electrochemically grown oxide being different from thermally grown oxide) still apply to this study. A more thorough characterization of the oxide and a general analysis including different oxide structures would help generalize the current model, which currently does not differentiate between different oxide types. In addition, the model makes other key assumptions and simplifications that could be challenged in the future to confirm the interpretation proposed in this study. For example, the model does not capture the increased surface diffusion of deuterium, discussed in the original paper (Kremer et al., 2022) as a key release mechanism, as deuterium atoms diffuse along the sample surface to find remaining pockets of oxygen to be released as DO. To model this, the geometry should be expanded to a 2D or 3D model, which is possible in TMAP8 (Franklin et al., 2025; Shimada et al., 2024; Simon et al., 2022; Simon et al., 2025).
The current study implemented the model and performed ad hoc calibration of the model parameters based on the potential driving mechanisms of oxide evolution and deuterium detrapping, diffusion, and surface reactions. While the experimentally-observed trends are qualitatively captured by the model, the simulation results are quantitatively different from the experimental measurements. Using Bayesian inference across all sets of experimental data would make it possible to calibrate the model to the experimental data while quantifying uncertainties and sources of error from model inadequacy, experimental error, and model-parameter uncertainty (Dhulipala et al., 2026; Dhulipala et al., 2025). The current oxygen diffusivity and D and DO release parameters are, therefore, best interpreted as calibrated effective kinetics for matching the observed TDS trends rather than as a mechanistic description, which will be the goal of future work.
Input files
The input files for this case are structured as follows:
The four cases, i.e., natural oxide, 5 nm, 10 nm, and 15 nm oxide thickness samples, are simulated using the (test/tests/val-2k/val-2k_natural_oxide.i), (test/tests/val-2k/val-2k_5nm_oxide.i), (test/tests/val-2k/val-2k_10nm_oxide.i), and (test/tests/val-2k/val-2k_15nm_oxide.i) inputs, respectively.
Their shared geometry, history, and material properties are listed in (test/tests/val-2k/parameters_val-2k_common.params), while the case-specific oxide thickness, output file names, and profile-output subfolder paths are defined directly in the wrapper input files.
The shared models are organized using (test/tests/val-2k/val-2k_base.i), (test/tests/val-2k/val-2k_layer.i), (test/tests/val-2k/val-2k_traps.i), and (test/tests/val-2k/val-2k_surface.i).
The associated tests are defined in (test/tests/val-2k/tests).
The input files used in this study are not optimized for performance. The solver and preconditioner type, mesh size, and time stepper could be optimized to reduce computational costs and memory needs.
References
- James Dark, Rémi Delaporte-Mathurin, Thomas Schwarz-Selinger, Etienne A Hodille, Jonathan Mougenot, Yann Charles, and Christian Grisolia.
Modelling neutron damage effects on tritium transport in tungsten.
Nuclear Fusion, 64(8):086026, 2024.[Export]
- Somayajulu L.N. Dhulipala, Peter German, Yifeng Che, Zachary M. Prince, Xianjian Xie, Pierre-Clément A. Simon, Vincent M. Labouré, and Hao Yan.
MOOSE ProbML: parallelized probabilistic machine learning and uncertainty quantification for computational energy applications.
Journal of Computational Science, 94:102776, 2026.
URL: https://www.sciencedirect.com/science/article/pii/S1877750325002534, doi:https://doi.org/10.1016/j.jocs.2025.102776.[Export]
- Somayajulu L.N. Dhulipala, Pierre-Clément A. Simon, Paul A. Demkowicz, Jacob A. Hirschhorn, and Stephen R. Novascone.
Unpacking model inadequacy: the quantification of silver release from TRISO fuel by considering empirical and mechanistic approaches.
Journal of Nuclear Materials, 610:155795, 2025.
URL: https://www.sciencedirect.com/science/article/pii/S0022311525001904, doi:https://doi.org/10.1016/j.jnucmat.2025.155795.[Export]
- Trevor Franklin, Casey Icenhour, Pierre-Clément A. Simon, Paul Humrickhouse, Fande Kong, and Lane B. Carasik.
New developments and verification of fusion blanket simulation capabilities in the MOOSE framework.
Fusion Engineering and Design, 218:115128, 2025.
doi:10.1016/j.fusengdes.2025.115128.[Export]
- De-en Jiang and E. A. Carter.
First-principles investigation on dissolution and diffusion of oxygen in tungsten.
Journal of Nuclear Materials, 393(3):508–512, 2009.
URL: https://doi.org/10.1016/j.jnucmat.2009.07.012, doi:10.1016/j.jnucmat.2009.07.012.[Export]
- K. Kremer, M. Brucker, W. Jacob, and T. Schwarz-Selinger.
Influence of thin surface oxide films on hydrogen isotope release from ion-irradiated tungsten.
Nuclear Materials and Energy, 30:101137, 2022.
URL: https://doi.org/10.1016/j.nme.2022.101137, doi:10.1016/j.nme.2022.101137.[Export]
- K. Kremer, T. Schwarz-Selinger, and W. Jacob.
Influence of thin tungsten oxide films on hydrogen isotope uptake and retention in tungsten – evidence for permeation barrier effect.
Nuclear Materials and Energy, 27:100991, 2021.
URL: https://doi.org/10.1016/j.nme.2021.100991, doi:10.1016/j.nme.2021.100991.[Export]
- Masashi Shimada, Pierre-Clément A. Simon, Casey T. Icenhour, and Gyanender Singh.
Toward a high-fidelity tritium transport modeling for retention and permeation experiments.
Fusion Engineering and Design, 203:114438, June 2024.
doi:10.1016/j.fusengdes.2024.114438.[Export]
- Pierre-Clément A. Simon, Paul W. Humrickhouse, and Alexander D. Lindsay.
Tritium Transport Modeling at the Pore Scale in Ceramic Breeder Materials Using TMAP8.
IEEE Transactions on Plasma Science, pages 1–7, 2022.
URL: https://ieeexplore.ieee.org/document/9831077/, doi:10.1109/TPS.2022.3183525.[Export]
- Pierre-Clément A. Simon, Casey T. Icenhour, Gyanender Singh, Alexander D Lindsay, Chaitanya Vivek Bhave, Lin Yang, Adriaan Anthony Riet, Yifeng Che, Paul Humrickhouse, Masashi Shimada, and Pattrick Calderoni.
MOOSE-based tritium migration analysis program, version 8 (TMAP8) for advanced open-source tritium transport and fuel cycle modeling.
Fusion Engineering and Design, 214:114874, May 2025.
doi:10.1016/j.fusengdes.2025.114874.[Export]